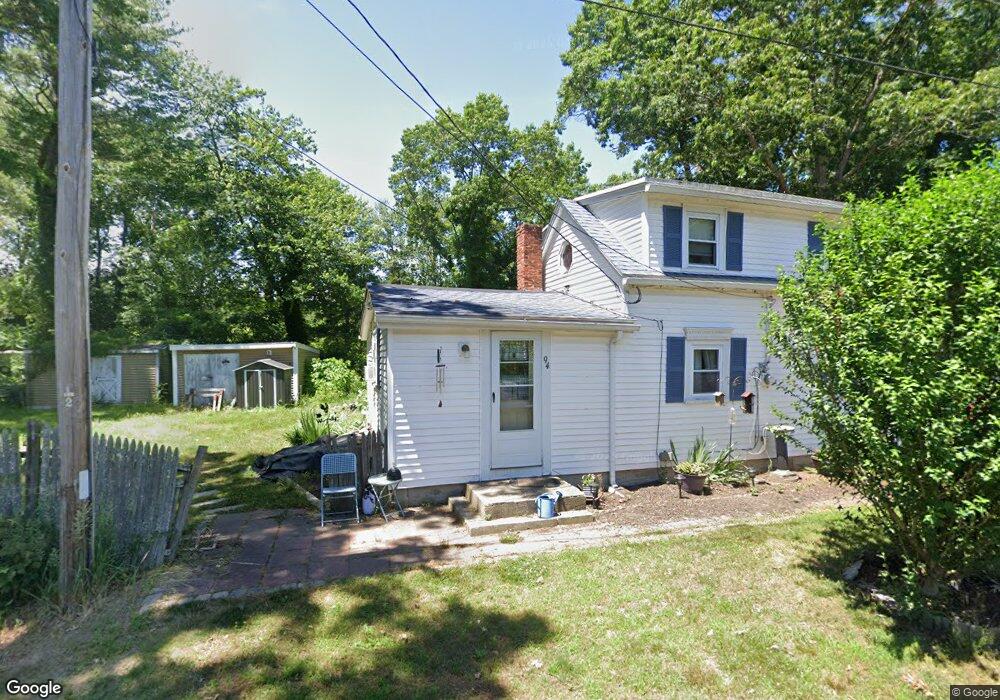
94 Charles St Hanson, MA 02341
Estimated Value: $406,098 - $491,000
3
Beds
1
Bath
1,390
Sq Ft
$320/Sq Ft
Est. Value
About This Home
This home is located at 94 Charles St, Hanson, MA 02341 and is currently estimated at $445,275, approximately $320 per square foot. 94 Charles St is a home.
Ownership History
Date
Name
Owned For
Owner Type
Purchase Details
Closed on
Feb 18, 2014
Sold by
Berryman Maureen A and Berryman Francis H
Bought by
Berryman Maureen
Current Estimated Value
Purchase Details
Closed on
Sep 22, 2006
Sold by
Berryman Maureen A
Bought by
Berryman Maureen A
Home Financials for this Owner
Home Financials are based on the most recent Mortgage that was taken out on this home.
Original Mortgage
$180,000
Interest Rate
6.59%
Create a Home Valuation Report for This Property
The Home Valuation Report is an in-depth analysis detailing your home's value as well as a comparison with similar homes in the area
Home Values in the Area
Average Home Value in this Area
Purchase History
| Date | Buyer | Sale Price | Title Company |
|---|---|---|---|
| Berryman Maureen | -- | -- | |
| Berryman Maureen A | -- | -- |
Source: Public Records
Mortgage History
| Date | Status | Borrower | Loan Amount |
|---|---|---|---|
| Previous Owner | Berryman Maureen A | $180,000 | |
| Previous Owner | Berryman Maureen A | $141,566 | |
| Previous Owner | Berryman Maureen A | $60,000 | |
| Previous Owner | Berryman Maureen A | $26,000 |
Source: Public Records
Tax History Compared to Growth
Tax History
| Year | Tax Paid | Tax Assessment Tax Assessment Total Assessment is a certain percentage of the fair market value that is determined by local assessors to be the total taxable value of land and additions on the property. | Land | Improvement |
|---|---|---|---|---|
| 2025 | $4,006 | $299,400 | $142,400 | $157,000 |
| 2024 | $3,892 | $290,900 | $138,300 | $152,600 |
| 2023 | $3,848 | $271,400 | $138,300 | $133,100 |
| 2022 | $3,726 | $246,900 | $125,700 | $121,200 |
| 2021 | $2,910 | $192,700 | $120,900 | $71,800 |
| 2020 | $2,767 | $181,200 | $116,800 | $64,400 |
| 2019 | $2,601 | $167,500 | $107,400 | $60,100 |
| 2018 | $2,571 | $162,400 | $103,200 | $59,200 |
| 2017 | $2,391 | $149,600 | $91,800 | $57,800 |
| 2016 | $2,459 | $148,600 | $91,800 | $56,800 |
| 2015 | $2,351 | $147,700 | $91,800 | $55,900 |
Source: Public Records
Map
Nearby Homes