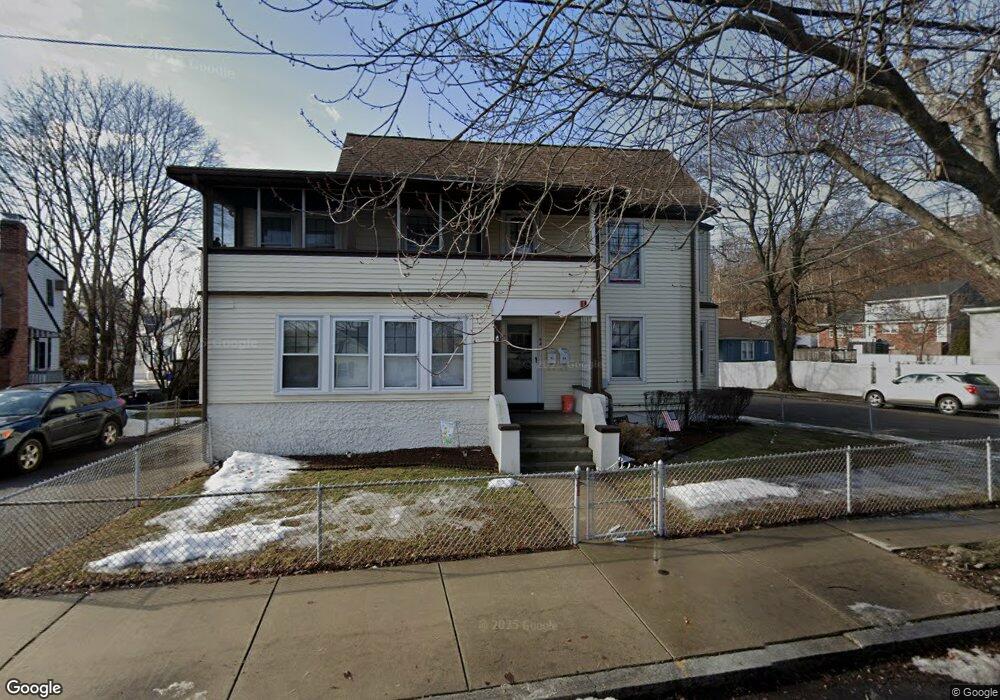
94 Cherry St Malden, MA 02148
Forestdale NeighborhoodEstimated Value: $862,000 - $1,335,000
4
Beds
3
Baths
3,515
Sq Ft
$302/Sq Ft
Est. Value
About This Home
This home is located at 94 Cherry St, Malden, MA 02148 and is currently estimated at $1,060,000, approximately $301 per square foot. 94 Cherry St is a home located in Middlesex County with nearby schools including Malden High School, Cheverus Centennial School, and Malden Catholic.
Ownership History
Date
Name
Owned For
Owner Type
Purchase Details
Closed on
Dec 28, 2017
Sold by
Digiovanni Peter F and Digiovanni Maureen A
Bought by
Digiovanni Maureen A
Current Estimated Value
Purchase Details
Closed on
May 27, 1994
Sold by
Digiovanni Henry J and Digiovanni Harret F
Bought by
Digiovanni Peter G
Home Financials for this Owner
Home Financials are based on the most recent Mortgage that was taken out on this home.
Original Mortgage
$150,000
Interest Rate
8.22%
Mortgage Type
Purchase Money Mortgage
Create a Home Valuation Report for This Property
The Home Valuation Report is an in-depth analysis detailing your home's value as well as a comparison with similar homes in the area
Home Values in the Area
Average Home Value in this Area
Purchase History
| Date | Buyer | Sale Price | Title Company |
|---|---|---|---|
| Digiovanni Maureen A | -- | -- | |
| Digiovanni Peter G | $150,000 | -- | |
| Digiovanni Peter G | $150,000 | -- |
Source: Public Records
Mortgage History
| Date | Status | Borrower | Loan Amount |
|---|---|---|---|
| Previous Owner | Digiovanni Peter G | $127,500 | |
| Previous Owner | Digiovanni Peter G | $150,000 | |
| Previous Owner | Digiovanni Peter G | $100,000 | |
| Previous Owner | Digiovanni Peter G | $60,000 |
Source: Public Records
Tax History
| Year | Tax Paid | Tax Assessment Tax Assessment Total Assessment is a certain percentage of the fair market value that is determined by local assessors to be the total taxable value of land and additions on the property. | Land | Improvement |
|---|---|---|---|---|
| 2025 | $105 | $927,700 | $324,700 | $603,000 |
| 2024 | $10,214 | $873,700 | $307,100 | $566,600 |
| 2023 | $9,898 | $812,000 | $280,800 | $531,200 |
| 2022 | $9,490 | $768,400 | $254,500 | $513,900 |
| 2021 | $9,764 | $794,500 | $232,500 | $562,000 |
| 2020 | $9,419 | $744,600 | $221,100 | $523,500 |
| 2019 | $9,187 | $692,300 | $210,600 | $481,700 |
| 2018 | $8,909 | $632,300 | $177,700 | $454,600 |
| 2017 | $8,652 | $610,600 | $177,700 | $432,900 |
| 2016 | $7,192 | $474,400 | $168,900 | $305,500 |
| 2015 | $6,849 | $435,400 | $159,300 | $276,100 |
| 2014 | $6,339 | $393,700 | $144,800 | $248,900 |
Source: Public Records
Map
Nearby Homes
- 58-60 Bainbridge St
- 16 Willard St
- 11 Havelock St
- 31 Preston St
- 124 Floral Ave
- 26 Webber St Unit 1
- 557 Salem St Unit 3
- 557 Salem St Unit 4
- 20 Huntley St
- 56 Rocky Nook Unit 56
- 10 Dell St
- 0 S Mountain Avenue & O Cargil
- 58 Clark St
- 40 Clark St
- 31 Temple St
- 30 Franklin St Unit 411
- 30 Franklin St Unit 124
- 241 Mountain Ave
- 48 Summit St
- 65 Beacon St
Your Personal Tour Guide
Ask me questions while you tour the home.