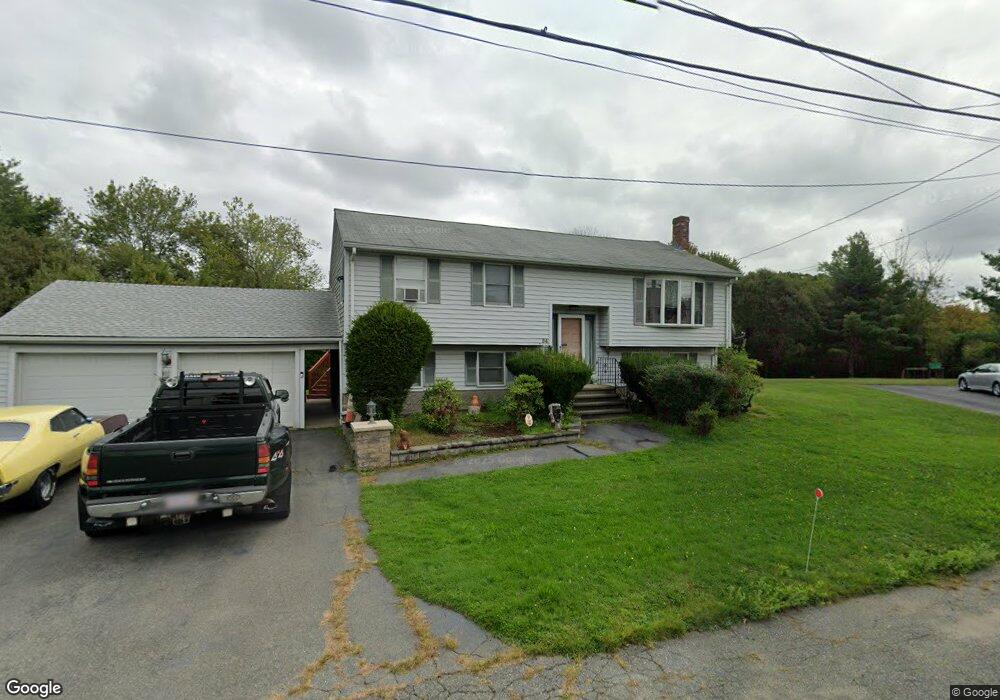
94 Chestnut Cir Randolph, MA 02368
North Randolph NeighborhoodEstimated Value: $592,000 - $706,000
2
Beds
2
Baths
1,704
Sq Ft
$390/Sq Ft
Est. Value
About This Home
This home is located at 94 Chestnut Cir, Randolph, MA 02368 and is currently estimated at $664,829, approximately $390 per square foot. 94 Chestnut Cir is a home located in Norfolk County with nearby schools including Randolph High School and Lighthouse Baptist Christian Academy.
Ownership History
Date
Name
Owned For
Owner Type
Purchase Details
Closed on
Jul 23, 1999
Sold by
Whynot Lester E and Whynot Carole S
Bought by
Underwood Daniel L
Current Estimated Value
Home Financials for this Owner
Home Financials are based on the most recent Mortgage that was taken out on this home.
Original Mortgage
$206,754
Outstanding Balance
$57,594
Interest Rate
7.49%
Mortgage Type
Purchase Money Mortgage
Estimated Equity
$607,235
Create a Home Valuation Report for This Property
The Home Valuation Report is an in-depth analysis detailing your home's value as well as a comparison with similar homes in the area
Home Values in the Area
Average Home Value in this Area
Purchase History
| Date | Buyer | Sale Price | Title Company |
|---|---|---|---|
| Underwood Daniel L | $240,000 | -- |
Source: Public Records
Mortgage History
| Date | Status | Borrower | Loan Amount |
|---|---|---|---|
| Open | Underwood Daniel L | $206,754 | |
| Previous Owner | Underwood Daniel L | $168,000 |
Source: Public Records
Tax History Compared to Growth
Tax History
| Year | Tax Paid | Tax Assessment Tax Assessment Total Assessment is a certain percentage of the fair market value that is determined by local assessors to be the total taxable value of land and additions on the property. | Land | Improvement |
|---|---|---|---|---|
| 2025 | $7,660 | $659,800 | $253,800 | $406,000 |
| 2024 | $7,517 | $656,500 | $248,700 | $407,800 |
| 2023 | $7,105 | $588,200 | $226,300 | $361,900 |
| 2022 | $6,835 | $502,600 | $188,400 | $314,200 |
| 2021 | $6,648 | $449,800 | $157,200 | $292,600 |
| 2020 | $6,438 | $431,800 | $157,200 | $274,600 |
| 2019 | $6,353 | $424,100 | $149,500 | $274,600 |
| 2018 | $6,312 | $397,500 | $135,900 | $261,600 |
| 2017 | $5,506 | $340,300 | $129,500 | $210,800 |
| 2016 | $5,335 | $306,800 | $117,700 | $189,100 |
| 2015 | $5,211 | $287,900 | $112,100 | $175,800 |
Source: Public Records
Map
Nearby Homes
- 2 Smith Rd
- 16 Simmonds Blvd Unit 16
- 20 Simmonds Blvd Unit 20
- 14 Simmonds Blvd Unit 14
- 12 Simmonds Blvd Unit 12
- 229 Chestnut St
- 34 Orchard St
- 591 N Main St
- 43 Emily Jeffers Rd
- 1 Clark Cir
- 7 Webster St
- 12 Webster St
- 12 Jasper Ln Unit 12
- 18 Jasper Ln
- 33 Liberty St
- 54 Jasper Ln
- 44 Liberty St
- 26 Knights Crescent St
- 33 Michael Rd
- 73 Belcher St
- 100 Chestnut Cir
- 99 Chestnut Cir
- 86 Chestnut Cir
- 89 Chestnut Cir
- 104 Chestnut Cir
- 84 Chestnut Cir
- 107 Chestnut Cir
- 83 Chestnut Cir
- 106 Chestnut Cir
- 80 Chestnut Cir
- 79 Chestnut Cir
- 113 Chestnut Cir
- 76 Chestnut Cir
- 75 Chestnut Cir
- 114 Chestnut Cir
- 123 Chestnut Cir
- 123 Chestnut Cir
- 73 Chestnut Cir
- 64 Chestnut Cir
- 63 Chestnut Cir