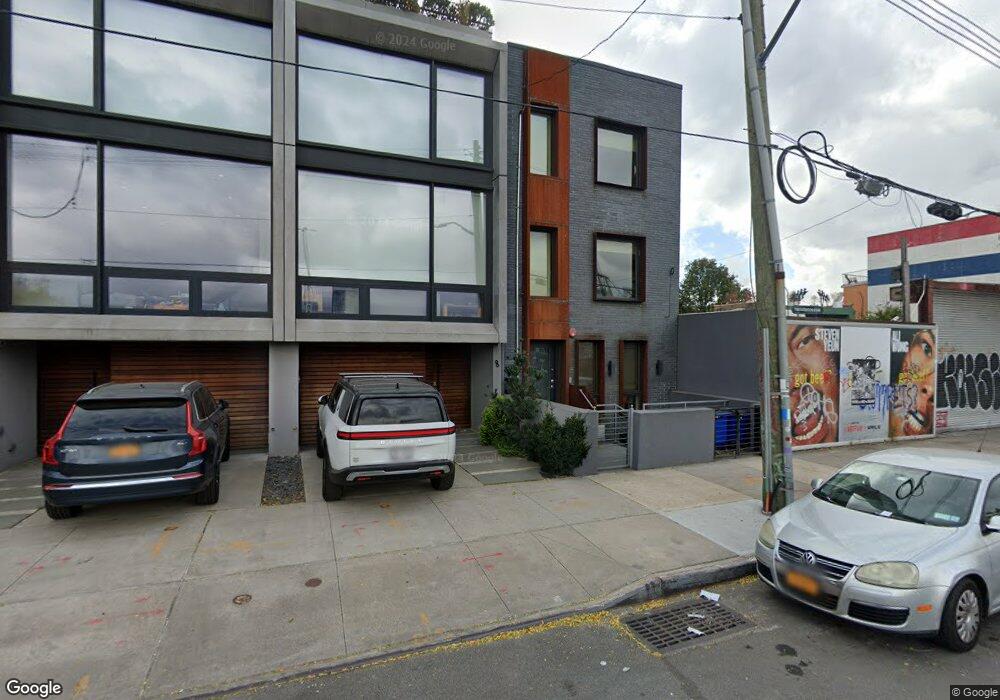
94 Degraw St Unit TWH Brooklyn, NY 11231
Carroll Gardens NeighborhoodEstimated Value: $2,794,771 - $3,198,000
3
Beds
4
Baths
2,397
Sq Ft
$1,242/Sq Ft
Est. Value
About This Home
This home is located at 94 Degraw St Unit TWH, Brooklyn, NY 11231 and is currently estimated at $2,976,693, approximately $1,241 per square foot. 94 Degraw St Unit TWH is a home located in Kings County with nearby schools including P.S. 29 John M. Harrigan, New Dawn Charter High School, and Brooklyn Heights Montessori School.
Ownership History
Date
Name
Owned For
Owner Type
Purchase Details
Closed on
Jan 17, 2020
Sold by
94 Degraw Llc
Bought by
Bilins Brett and Bilins Paige
Current Estimated Value
Home Financials for this Owner
Home Financials are based on the most recent Mortgage that was taken out on this home.
Original Mortgage
$12,500
Outstanding Balance
$11,066
Interest Rate
3.7%
Mortgage Type
New Conventional
Estimated Equity
$2,965,628
Purchase Details
Closed on
Aug 15, 2016
Sold by
East Coast Properties And Development Gr and Cruz Olga
Bought by
94 Degraws Llc
Home Financials for this Owner
Home Financials are based on the most recent Mortgage that was taken out on this home.
Original Mortgage
$400,000
Interest Rate
3.42%
Mortgage Type
New Conventional
Purchase Details
Closed on
Jul 27, 2006
Sold by
Cantres Olga
Bought by
Cantres Olga and Cruz Olga
Create a Home Valuation Report for This Property
The Home Valuation Report is an in-depth analysis detailing your home's value as well as a comparison with similar homes in the area
Home Values in the Area
Average Home Value in this Area
Purchase History
| Date | Buyer | Sale Price | Title Company |
|---|---|---|---|
| Bilins Brett | $2,350,000 | -- | |
| Bilins Brett | $2,350,000 | -- | |
| 94 Degraws Llc | -- | -- | |
| 94 Degraws Llc | -- | -- | |
| East Coast Properties And Development Gr | $1,050,000 | -- | |
| Cantres Olga | -- | -- | |
| Cantres Olga | -- | -- |
Source: Public Records
Mortgage History
| Date | Status | Borrower | Loan Amount |
|---|---|---|---|
| Open | Bilins Brett | $12,500 | |
| Closed | Bilins Brett | $12,500 | |
| Previous Owner | East Coast Properties And Development Gr | $400,000 | |
| Previous Owner | 94 Degraws Llc | $1,050,000 | |
| Closed | Cantres Olga | $0 |
Source: Public Records
Tax History Compared to Growth
Tax History
| Year | Tax Paid | Tax Assessment Tax Assessment Total Assessment is a certain percentage of the fair market value that is determined by local assessors to be the total taxable value of land and additions on the property. | Land | Improvement |
|---|---|---|---|---|
| 2025 | $7,998 | $179,280 | $20,760 | $158,520 |
| 2024 | $7,998 | $141,600 | $20,760 | $120,840 |
| 2023 | $7,629 | $125,160 | $20,760 | $104,400 |
| 2022 | $7,075 | $102,420 | $20,760 | $81,660 |
| 2021 | $7,210 | $79,080 | $20,760 | $58,320 |
| 2020 | $2,549 | $60,180 | $20,760 | $39,420 |
| 2019 | $4,579 | $56,640 | $20,760 | $35,880 |
| 2018 | $4,267 | $22,394 | $8,552 | $13,842 |
| 2017 | $4,228 | $22,213 | $4,402 | $17,811 |
| 2016 | $3,934 | $21,228 | $5,680 | $15,548 |
| 2015 | $2,308 | $20,304 | $8,138 | $12,166 |
| 2014 | $2,308 | $19,407 | $7,779 | $11,628 |
Source: Public Records
Map
Nearby Homes
- 181 Columbia St
- 113 Union St Unit 3A
- 130 Degraw St
- 139 Sackett St Unit 2
- 60 Tiffany Place Unit 2G
- 118 Union St Unit 9A
- 81 President St Unit 51-A
- 255 Columbia St Unit S-4
- 178 Sackett St
- 1 Tiffany Place Unit 5E
- 1 Tiffany Place Unit 2F
- 54 Cheever Place
- 177 Union St Unit 2
- 113A Columbia St
- 113 A Columbia St
- 10 Carroll St
- 57 Summit St
- 145 President St Unit 6-C
- 145 President St Unit 3-B
- 124 Kane St
- 94 Degraw St Unit TWHS
- 94 Degraw St Unit HOUSE
- 94 Degraw St
- 96-98 Degraw St
- 96 Degraw St
- 98 Degraw St Unit Building
- 98 Degraw St
- 100 Degraw St Unit 4
- 100 Degraw St Unit 1
- 4 Degraw St
- 102 Degraw St
- 102 Degraw St Unit 4
- 90 Degraw St
- 104 Degraw St
- 106 Degraw St
- 82 Degraw St
- 101-103 Sackett St
- 108 Degraw St
- 108 Degraw St Unit 2
- 108 Degraw St Unit 1