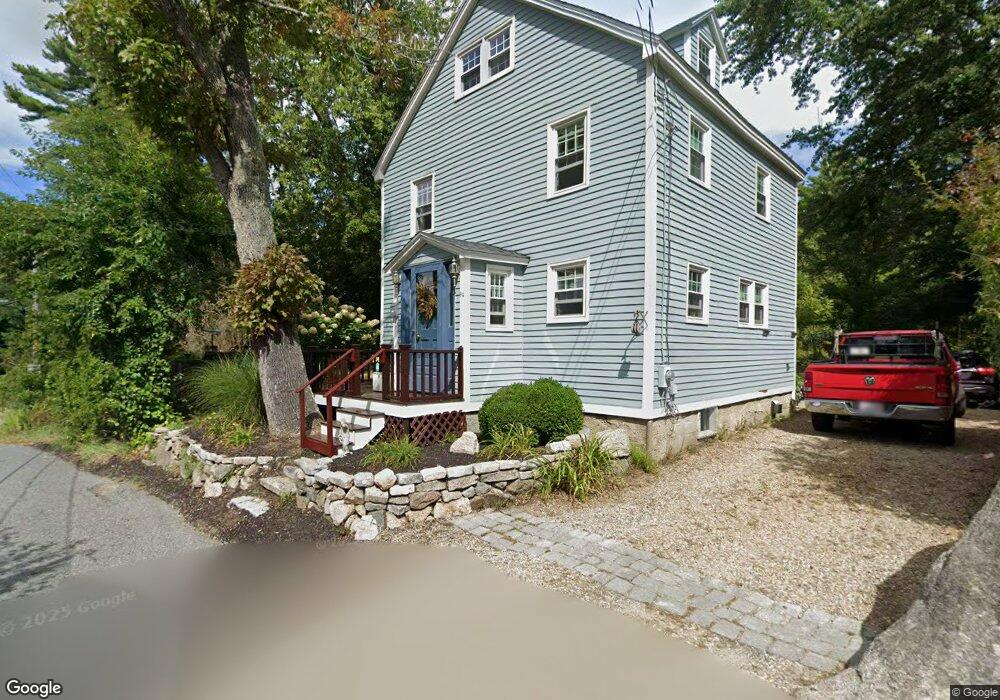
94 Dennison St Gloucester, MA 01930
Estimated Value: $671,579 - $947,000
3
Beds
2
Baths
1,282
Sq Ft
$609/Sq Ft
Est. Value
About This Home
This home is located at 94 Dennison St, Gloucester, MA 01930 and is currently estimated at $780,145, approximately $608 per square foot. 94 Dennison St is a home located in Essex County with nearby schools including Plum Cove School, Ralph B O'maley Middle School, and Gloucester High School.
Ownership History
Date
Name
Owned For
Owner Type
Purchase Details
Closed on
Feb 4, 2005
Sold by
Snyder Kevin W
Bought by
Halloran Paul J
Current Estimated Value
Home Financials for this Owner
Home Financials are based on the most recent Mortgage that was taken out on this home.
Original Mortgage
$412,200
Interest Rate
5.77%
Purchase Details
Closed on
Jul 19, 1993
Sold by
Brooks Laura D Est
Bought by
Snyder Kevin W and Snyder Susan
Create a Home Valuation Report for This Property
The Home Valuation Report is an in-depth analysis detailing your home's value as well as a comparison with similar homes in the area
Home Values in the Area
Average Home Value in this Area
Purchase History
| Date | Buyer | Sale Price | Title Company |
|---|---|---|---|
| Halloran Paul J | $458,000 | -- | |
| Snyder Kevin W | $90,475 | -- |
Source: Public Records
Mortgage History
| Date | Status | Borrower | Loan Amount |
|---|---|---|---|
| Open | Snyder Kevin W | $408,000 | |
| Closed | Snyder Kevin W | $414,400 | |
| Closed | Snyder Kevin W | $412,200 |
Source: Public Records
Tax History Compared to Growth
Tax History
| Year | Tax Paid | Tax Assessment Tax Assessment Total Assessment is a certain percentage of the fair market value that is determined by local assessors to be the total taxable value of land and additions on the property. | Land | Improvement |
|---|---|---|---|---|
| 2025 | $5,786 | $594,700 | $244,800 | $349,900 |
| 2024 | $5,786 | $594,700 | $244,800 | $349,900 |
| 2023 | $5,546 | $523,700 | $218,500 | $305,200 |
| 2022 | $5,250 | $447,600 | $185,700 | $261,900 |
| 2021 | $5,063 | $407,000 | $168,800 | $238,200 |
| 2020 | $4,955 | $401,900 | $168,800 | $233,100 |
| 2019 | $4,731 | $372,800 | $168,800 | $204,000 |
| 2018 | $4,553 | $352,100 | $168,800 | $183,300 |
| 2017 | $4,412 | $334,500 | $160,800 | $173,700 |
| 2016 | $4,272 | $313,900 | $161,500 | $152,400 |
| 2015 | $4,124 | $302,100 | $161,500 | $140,600 |
Source: Public Records
Map
Nearby Homes
- 79 Dennison St
- 672 Washington St
- 6 River Rd
- 3 Colburn St
- 3 Colburn St Unit 2
- 3 Colburn St Unit 1
- 962 Washington St
- 49 Thurston Point Rd
- 226 Atlantic St
- 6 Mount Locust Place Unit 2
- 16 Reynard St
- 188 Atlantic St
- 178 Atlantic St
- 18 Cherry St
- 177 Main St
- 19 Mystic Ave
- 273 Washington St Unit 2
- 1 Doctors Run
- 2 Norseman Ave
- 26 Quarry Ridge Ln
- 100 Dennison St
- 83 Dennison St
- 86 Dennison St
- 81 Dennison St
- 98 Holly St
- 102 Dennison St
- 90 Dennison St
- 92 Dennison St Unit 94
- 75 Dennison St
- 104 Dennison St
- 87 Dennison St
- 91 Dennison St
- 108 Dennison St
- 65 Dennison St
- 92 Holly St
- 82 Dennison St
- 79 Holly St
- 84 Dennison St
- 62 Bennett St S
- 55 Dennison St