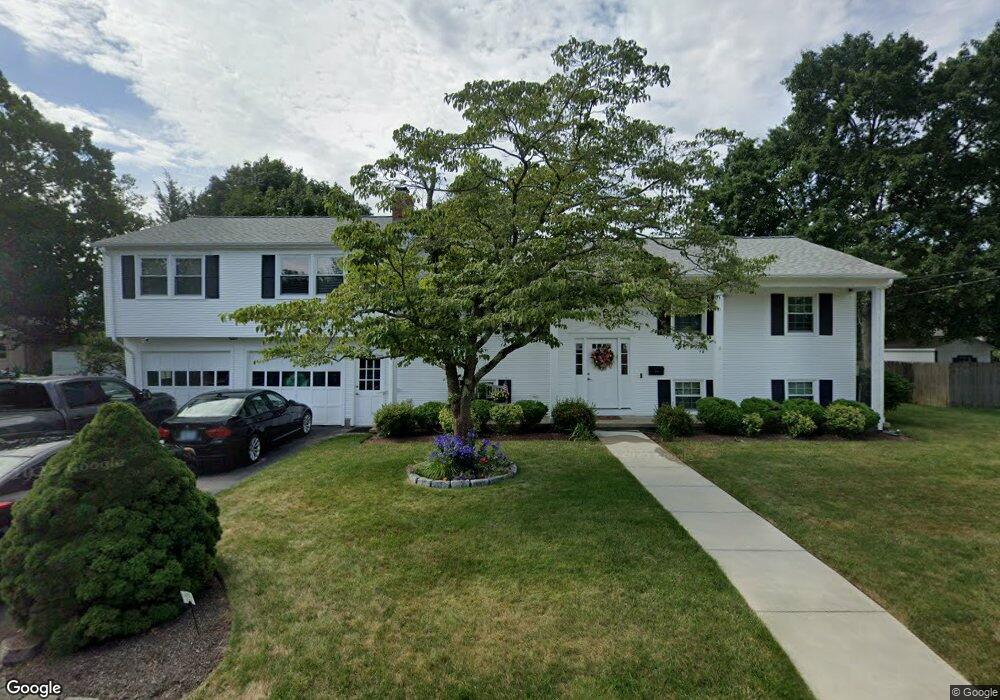
94 Doris Ave Warwick, RI 02889
Hoxie NeighborhoodEstimated Value: $422,000 - $568,000
4
Beds
2
Baths
2,482
Sq Ft
$202/Sq Ft
Est. Value
About This Home
This home is located at 94 Doris Ave, Warwick, RI 02889 and is currently estimated at $501,616, approximately $202 per square foot. 94 Doris Ave is a home located in Kent County with nearby schools including Saint Kevin School and Bishop Hendricken High School.
Ownership History
Date
Name
Owned For
Owner Type
Purchase Details
Closed on
Feb 29, 2008
Sold by
Us Bank Na
Bought by
Radtke Leonard J
Current Estimated Value
Home Financials for this Owner
Home Financials are based on the most recent Mortgage that was taken out on this home.
Original Mortgage
$173,375
Outstanding Balance
$105,865
Interest Rate
5.8%
Mortgage Type
Purchase Money Mortgage
Estimated Equity
$395,751
Purchase Details
Closed on
Aug 19, 2002
Sold by
Viveiros Mary K
Bought by
Kean Warren
Purchase Details
Closed on
Sep 29, 1989
Sold by
Lane Ethel L
Bought by
Viveiros Michael C
Create a Home Valuation Report for This Property
The Home Valuation Report is an in-depth analysis detailing your home's value as well as a comparison with similar homes in the area
Home Values in the Area
Average Home Value in this Area
Purchase History
| Date | Buyer | Sale Price | Title Company |
|---|---|---|---|
| Radtke Leonard J | $182,500 | -- | |
| Kean Warren | $208,500 | -- | |
| Viveiros Michael C | $125,000 | -- | |
| Viveiros Michael C | $125,000 | -- |
Source: Public Records
Mortgage History
| Date | Status | Borrower | Loan Amount |
|---|---|---|---|
| Open | Viveiros Michael C | $173,375 | |
| Previous Owner | Viveiros Michael C | $277,950 | |
| Previous Owner | Viveiros Michael C | $248,000 |
Source: Public Records
Tax History
| Year | Tax Paid | Tax Assessment Tax Assessment Total Assessment is a certain percentage of the fair market value that is determined by local assessors to be the total taxable value of land and additions on the property. | Land | Improvement |
|---|---|---|---|---|
| 2025 | $6,092 | $479,700 | $106,600 | $373,100 |
| 2024 | $6,280 | $434,000 | $92,700 | $341,300 |
| 2023 | $6,158 | $434,000 | $92,700 | $341,300 |
| 2022 | $6,009 | $320,800 | $65,200 | $255,600 |
| 2021 | $6,009 | $320,800 | $65,200 | $255,600 |
| 2020 | $6,009 | $320,800 | $65,200 | $255,600 |
| 2019 | $6,009 | $320,800 | $65,200 | $255,600 |
| 2018 | $5,787 | $278,200 | $65,200 | $213,000 |
| 2017 | $5,631 | $278,200 | $65,200 | $213,000 |
| 2016 | $5,639 | $278,600 | $65,200 | $213,400 |
| 2015 | $4,974 | $239,700 | $58,000 | $181,700 |
| 2014 | $4,808 | $239,700 | $58,000 | $181,700 |
| 2013 | $4,744 | $239,700 | $58,000 | $181,700 |
Source: Public Records
Map
Nearby Homes
Your Personal Tour Guide
Ask me questions while you tour the home.