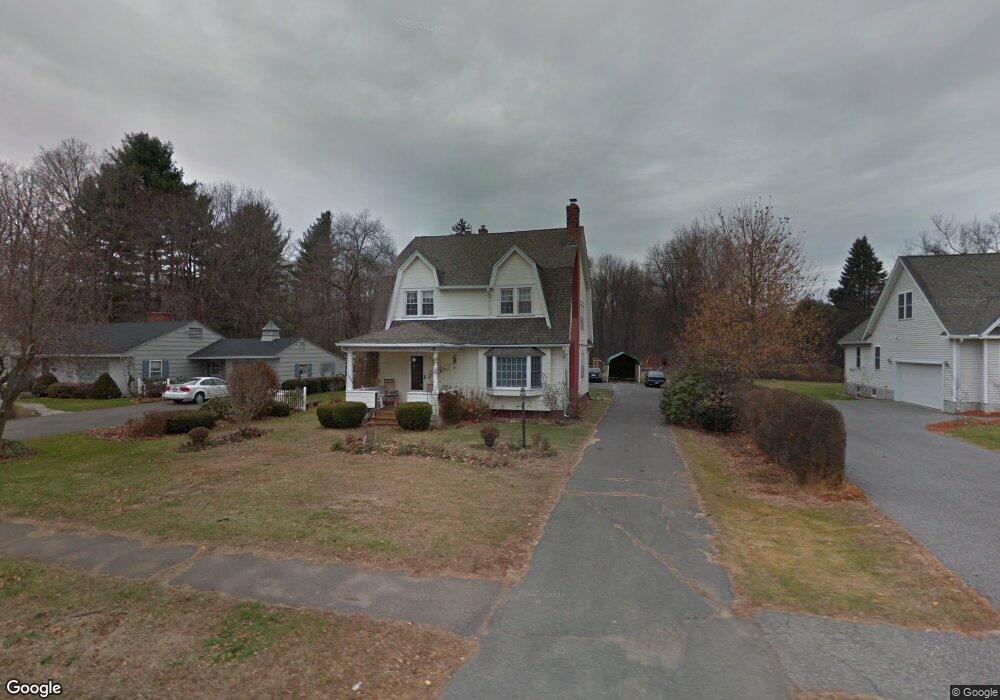
94 Elm St Agawam, MA 01001
Estimated Value: $422,000 - $475,000
4
Beds
2
Baths
2,602
Sq Ft
$173/Sq Ft
Est. Value
About This Home
This home is located at 94 Elm St, Agawam, MA 01001 and is currently estimated at $448,867, approximately $172 per square foot. 94 Elm St is a home located in Hampden County with nearby schools including Agawam Junior High School and Agawam High School.
Ownership History
Date
Name
Owned For
Owner Type
Purchase Details
Closed on
Aug 29, 2001
Sold by
Est Reilly Elizabeth R and Rivkin Lea Rose
Bought by
Paro Cindya J and Paro Kenneth E
Current Estimated Value
Home Financials for this Owner
Home Financials are based on the most recent Mortgage that was taken out on this home.
Original Mortgage
$140,000
Outstanding Balance
$54,871
Interest Rate
7.06%
Mortgage Type
Purchase Money Mortgage
Estimated Equity
$393,996
Create a Home Valuation Report for This Property
The Home Valuation Report is an in-depth analysis detailing your home's value as well as a comparison with similar homes in the area
Home Values in the Area
Average Home Value in this Area
Purchase History
| Date | Buyer | Sale Price | Title Company |
|---|---|---|---|
| Paro Cindya J | $175,000 | -- |
Source: Public Records
Mortgage History
| Date | Status | Borrower | Loan Amount |
|---|---|---|---|
| Open | Paro Cindya J | $140,000 |
Source: Public Records
Tax History Compared to Growth
Tax History
| Year | Tax Paid | Tax Assessment Tax Assessment Total Assessment is a certain percentage of the fair market value that is determined by local assessors to be the total taxable value of land and additions on the property. | Land | Improvement |
|---|---|---|---|---|
| 2025 | $5,493 | $375,200 | $149,900 | $225,300 |
| 2024 | $5,381 | $370,100 | $149,900 | $220,200 |
| 2023 | $5,166 | $327,400 | $137,700 | $189,700 |
| 2022 | $4,814 | $298,800 | $137,700 | $161,100 |
| 2021 | $4,801 | $285,800 | $124,800 | $161,000 |
| 2020 | $4,682 | $278,200 | $123,200 | $155,000 |
| 2019 | $4,507 | $270,700 | $121,100 | $149,600 |
| 2018 | $4,108 | $247,300 | $108,900 | $138,400 |
| 2017 | $3,926 | $240,700 | $108,900 | $131,800 |
| 2016 | $3,859 | $238,500 | $108,900 | $129,600 |
| 2015 | $3,680 | $233,800 | $108,900 | $124,900 |
Source: Public Records
Map
Nearby Homes
- 869-871 Main St
- 4H Mapleviewlane Unit 4H
- 0 Silver St
- 64 Woodside Dr
- 4 H Castle Hills Rd Unit H
- 1 Castle Hill Rd Unit D
- 15 B Castle Hills Rd Unit B
- 25 Castle Hill Rd Unit E
- 15 Bailey St
- 52 Peros Dr
- 6 Mansion Woods Dr Unit A
- 20 Castle Hill Rd Unit D
- 49 Hearthstone Dr
- 73 Silver Lake Dr
- 420 Main St Unit 82
- 420 Main St Unit 71
- 83 Fairview St
- 135 Corey Colonial
- 14 Greenacre Ln
- 95 Meadowbrook Rd