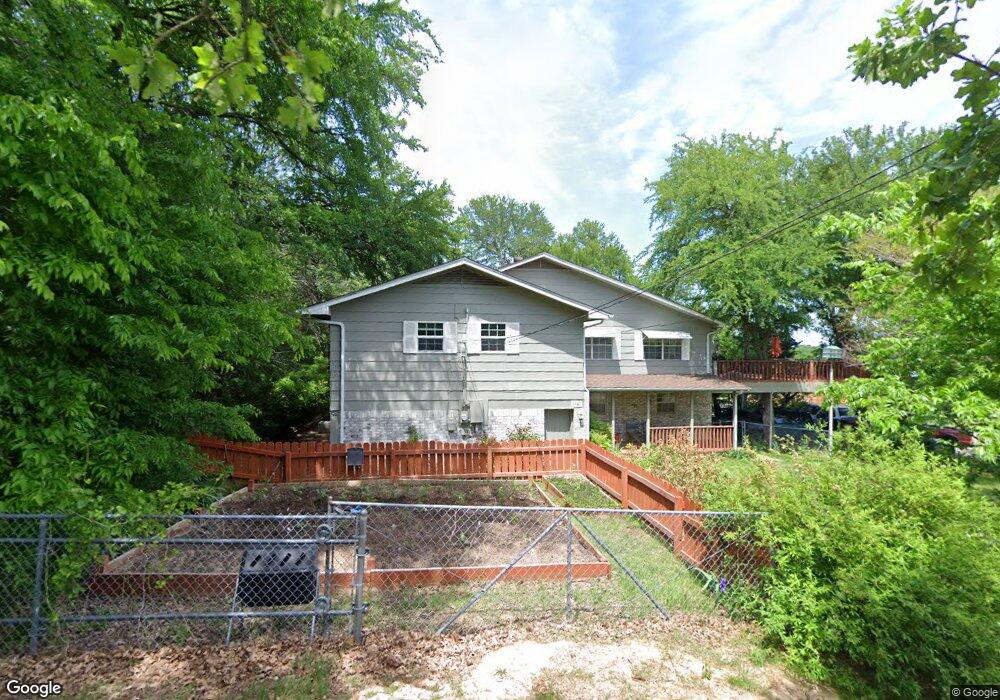
94 Erin Dr Pottsboro, TX 75076
Estimated Value: $346,000 - $539,000
4
Beds
2
Baths
3,622
Sq Ft
$121/Sq Ft
Est. Value
About This Home
This home is located at 94 Erin Dr, Pottsboro, TX 75076 and is currently estimated at $439,699, approximately $121 per square foot. 94 Erin Dr is a home located in Grayson County with nearby schools including Pottsboro Elementary School, Pottsboro Middle School, and Pottsboro High School.
Ownership History
Date
Name
Owned For
Owner Type
Purchase Details
Closed on
Apr 12, 2019
Sold by
Dodd James Robert and Dodd Dolores V
Bought by
Mccabe Seckman John
Current Estimated Value
Home Financials for this Owner
Home Financials are based on the most recent Mortgage that was taken out on this home.
Original Mortgage
$171,900
Outstanding Balance
$159,333
Interest Rate
7.5%
Mortgage Type
Adjustable Rate Mortgage/ARM
Estimated Equity
$280,366
Purchase Details
Closed on
Sep 3, 2015
Sold by
Reverse Mortgage Solutions Inc
Bought by
Dodd James Robert
Home Financials for this Owner
Home Financials are based on the most recent Mortgage that was taken out on this home.
Original Mortgage
$81,550
Interest Rate
3.92%
Mortgage Type
Commercial
Purchase Details
Closed on
Feb 12, 2015
Sold by
Workman Marjorie Christine
Bought by
Reverse Mortgage Solutions Inc
Create a Home Valuation Report for This Property
The Home Valuation Report is an in-depth analysis detailing your home's value as well as a comparison with similar homes in the area
Home Values in the Area
Average Home Value in this Area
Purchase History
| Date | Buyer | Sale Price | Title Company |
|---|---|---|---|
| Mccabe Seckman John | -- | Grayson County Title | |
| Dodd James Robert | -- | Brahma Title & Escrow | |
| Reverse Mortgage Solutions Inc | $168,711 | None Available |
Source: Public Records
Mortgage History
| Date | Status | Borrower | Loan Amount |
|---|---|---|---|
| Open | Mccabe Seckman John | $171,900 | |
| Previous Owner | Dodd James Robert | $81,550 |
Source: Public Records
Tax History Compared to Growth
Tax History
| Year | Tax Paid | Tax Assessment Tax Assessment Total Assessment is a certain percentage of the fair market value that is determined by local assessors to be the total taxable value of land and additions on the property. | Land | Improvement |
|---|---|---|---|---|
| 2025 | $2,641 | $338,264 | -- | -- |
| 2024 | $3,779 | $272,791 | $0 | $0 |
| 2023 | $2,321 | $247,992 | $0 | $0 |
| 2022 | $4,874 | $309,653 | $38,355 | $271,298 |
| 2021 | $3,441 | $211,576 | $18,365 | $193,211 |
| 2020 | $3,145 | $186,320 | $20,202 | $166,118 |
| 2019 | $4,089 | $231,135 | $25,711 | $205,424 |
| 2018 | $3,561 | $198,753 | $14,692 | $184,061 |
| 2017 | $3,303 | $181,980 | $14,692 | $167,288 |
| 2016 | $3,306 | $182,152 | $14,692 | $167,460 |
| 2015 | $2,989 | $161,804 | $14,692 | $147,112 |
| 2014 | $2,915 | $156,513 | $14,692 | $141,821 |
Source: Public Records
Map
Nearby Homes
- 11 Mayfield Ln
- 83 Mayfield Ln
- 545 Black Forest Dr
- 491 Black Forest Dr
- 226 Cambridge Dr
- 142 Wales Dr
- 344 Castle Dr
- 16 Wales Dr
- 34 Cambridge Dr
- 81 Windsor Dr
- 191 Black Forest Dr
- 207 Wales Dr
- 219 Ray Rd
- 33 Queens Dr
- 116 Oak Hills Dr
- 766 Lakepoint Loop
- 258 Lou-Sand Hill Rd
- 118 Hacienda Dr
- 110 Eagleview Cir
- 120 Eagleview Cir