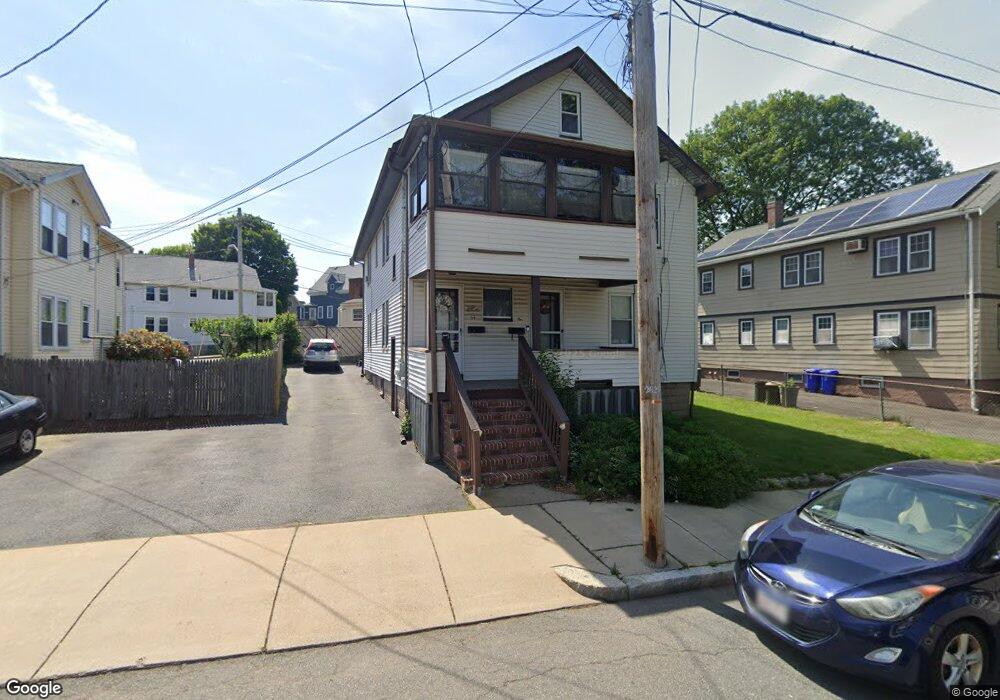
94 Home St Unit 96 Malden, MA 02148
Maplewood NeighborhoodEstimated Value: $809,000 - $1,195,000
4
Beds
2
Baths
2,574
Sq Ft
$372/Sq Ft
Est. Value
About This Home
This home is located at 94 Home St Unit 96, Malden, MA 02148 and is currently estimated at $957,375, approximately $371 per square foot. 94 Home St Unit 96 is a home located in Middlesex County with nearby schools including Malden High School, Cheverus Catholic School, and Malden Catholic.
Ownership History
Date
Name
Owned For
Owner Type
Purchase Details
Closed on
Jun 8, 2000
Sold by
Gingras Marguerite I and Gingras Edward J
Bought by
Paige Edward M
Current Estimated Value
Home Financials for this Owner
Home Financials are based on the most recent Mortgage that was taken out on this home.
Original Mortgage
$176,000
Outstanding Balance
$61,604
Interest Rate
8.12%
Mortgage Type
Purchase Money Mortgage
Estimated Equity
$895,771
Create a Home Valuation Report for This Property
The Home Valuation Report is an in-depth analysis detailing your home's value as well as a comparison with similar homes in the area
Home Values in the Area
Average Home Value in this Area
Purchase History
| Date | Buyer | Sale Price | Title Company |
|---|---|---|---|
| Paige Edward M | $220,000 | -- |
Source: Public Records
Mortgage History
| Date | Status | Borrower | Loan Amount |
|---|---|---|---|
| Open | Paige Edward M | $176,000 | |
| Closed | Paige Edward M | $44,000 |
Source: Public Records
Tax History Compared to Growth
Tax History
| Year | Tax Paid | Tax Assessment Tax Assessment Total Assessment is a certain percentage of the fair market value that is determined by local assessors to be the total taxable value of land and additions on the property. | Land | Improvement |
|---|---|---|---|---|
| 2025 | $94 | $834,300 | $297,700 | $536,600 |
| 2024 | $9,185 | $785,700 | $281,600 | $504,100 |
| 2023 | $8,904 | $730,400 | $257,500 | $472,900 |
| 2022 | $8,528 | $690,500 | $233,400 | $457,100 |
| 2021 | $9,075 | $738,400 | $213,200 | $525,200 |
| 2020 | $8,737 | $690,700 | $202,800 | $487,900 |
| 2019 | $8,192 | $617,300 | $193,100 | $424,200 |
| 2018 | $7,931 | $562,900 | $163,000 | $399,900 |
| 2017 | $7,701 | $543,500 | $163,000 | $380,500 |
| 2016 | $6,232 | $411,100 | $154,900 | $256,200 |
| 2015 | $6,009 | $382,000 | $146,100 | $235,900 |
| 2014 | $5,643 | $350,500 | $132,800 | $217,700 |
Source: Public Records
Map
Nearby Homes
- 90 Home St Unit 92
- 100 Home St
- 93 Home St Unit 95
- 89 Home St
- 133 Private Ave - House
- 83 Home St Unit 83
- 68 Noble St
- 80-82 Home St
- 25 Erickson St
- 5 Field St
- 97 Home St Unit 99
- 80 Home St Unit 82
- 85 Home St
- 11 Field St
- 93-95 Home St
- 5 Constance St
- 14 Erickson St Unit 16
- 79 Home St
- 97-99 Home St
- 61 Noble St