Estimated Value: $583,000 - $765,000
3
Beds
2
Baths
2,010
Sq Ft
$319/Sq Ft
Est. Value
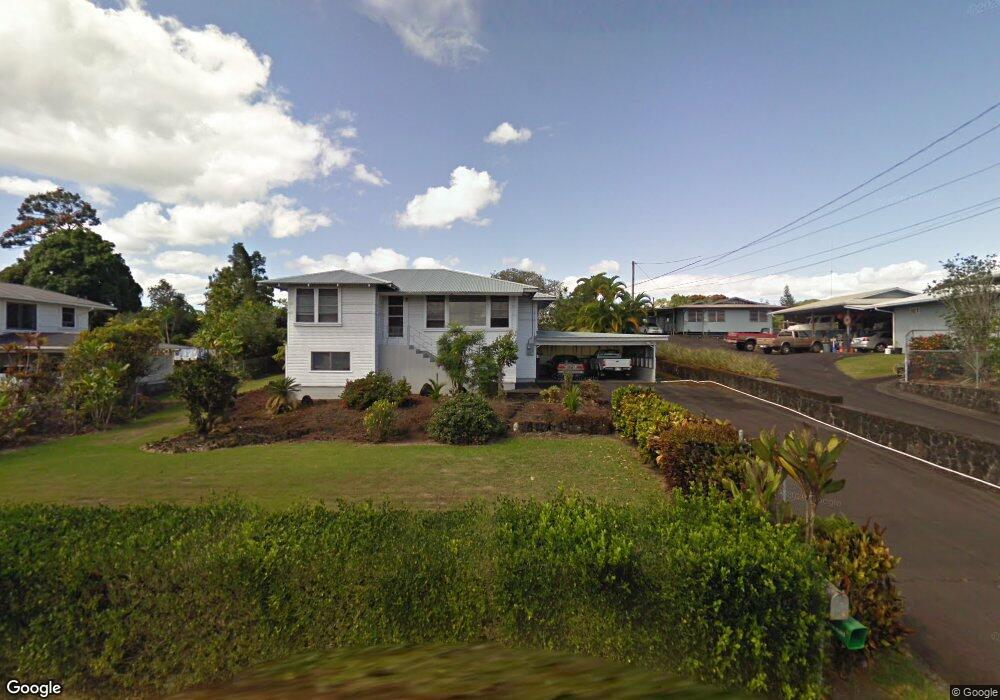
About This Home
This home is located at 94 Hoonanea St, Hilo, HI 96720 and is currently estimated at $641,474, approximately $319 per square foot. 94 Hoonanea St is a home located in Hawaii County with nearby schools including Waiakeawaena Elementary School, Waiakea Intermediate School, and Waiakea High School.
Ownership History
Date
Name
Owned For
Owner Type
Purchase Details
Closed on
Sep 30, 2021
Sold by
Leonard Kathleen Rose and Peard Kathleen Rose
Bought by
Leonard Kathleen R and Kathleen R Leonard Living Trus
Current Estimated Value
Purchase Details
Closed on
May 9, 2006
Sold by
Oness Scott
Bought by
Peard Randall John and Peard Kathleen Rose Leonard
Home Financials for this Owner
Home Financials are based on the most recent Mortgage that was taken out on this home.
Original Mortgage
$261,350
Outstanding Balance
$151,449
Interest Rate
6.41%
Mortgage Type
Fannie Mae Freddie Mac
Estimated Equity
$490,025
Purchase Details
Closed on
Mar 14, 2005
Sold by
Lindsey Cynthia Joan
Bought by
Oness Scott
Home Financials for this Owner
Home Financials are based on the most recent Mortgage that was taken out on this home.
Original Mortgage
$213,750
Interest Rate
5.61%
Mortgage Type
Purchase Money Mortgage
Purchase Details
Closed on
Sep 6, 2001
Sold by
Kimi Kenneth P
Bought by
Kimi Kenneth P and Revocable Trust Of Kenneth P Kimi
Create a Home Valuation Report for This Property
The Home Valuation Report is an in-depth analysis detailing your home's value as well as a comparison with similar homes in the area
Home Values in the Area
Average Home Value in this Area
Purchase History
| Date | Buyer | Sale Price | Title Company |
|---|---|---|---|
| Leonard Kathleen R | -- | None Available | |
| Peard Randall John | $326,700 | Tg | |
| Oness Scott | $285,000 | -- | |
| Kimi Kenneth P | -- | -- |
Source: Public Records
Mortgage History
| Date | Status | Borrower | Loan Amount |
|---|---|---|---|
| Open | Peard Randall John | $261,350 | |
| Previous Owner | Oness Scott | $213,750 |
Source: Public Records
Tax History
| Year | Tax Paid | Tax Assessment Tax Assessment Total Assessment is a certain percentage of the fair market value that is determined by local assessors to be the total taxable value of land and additions on the property. | Land | Improvement |
|---|---|---|---|---|
| 2025 | $672 | $278,800 | $110,100 | $168,700 |
| 2024 | $634 | $270,700 | $110,100 | $160,600 |
| 2023 | $616 | $262,800 | $110,100 | $152,700 |
| 2022 | $640 | $255,100 | $110,100 | $145,000 |
| 2021 | $604 | $247,700 | $110,100 | $137,600 |
| 2020 | $568 | $240,500 | $110,100 | $130,400 |
| 2019 | $534 | $233,500 | $110,100 | $123,400 |
| 2018 | $501 | $226,700 | $110,100 | $116,600 |
| 2017 | $468 | $220,100 | $110,100 | $110,000 |
| 2016 | $437 | $213,700 | $110,100 | $103,600 |
| 2015 | -- | $207,500 | $110,100 | $97,400 |
| 2014 | -- | $206,100 | $110,100 | $96,000 |
Source: Public Records
Map
Nearby Homes
- 155 W Kawailani St
- 89 W Kawailani St
- 347 Nohea St
- 118 W Kawailani St
- 2501 Kilauea Ave
- 3047 Lou St
- 314 Olu St
- 2501 Kinoole St
- 76 E Palai St
- 2669 Kilauea Ave
- 2557 Kinoole St
- 2059 Kinoole St
- 199 Kehaulani St Unit 3
- 99 Elm Dr
- 25 Awapuhi St
- 29 Laula Rd
- 450 Pohakulani St
- 39 Laula Rd
- 126 W Kinai Place
- 508 Ekela St
- 499 Kehaulani St
- 517 Kehaulani St
- 517A Kehaulani St
- 481 Kehaulani St
- 92 Hoonanea St
- 521 Kehaulani St
- 144 Hoonanea St
- 140 Hoonanea St
- 152 Hoonanea St
- 519 Kehaulani St
- 128 Hoonanea St
- 500 Kehaulani St
- 514 Kehaulani St
- 533 Kehaulani St
- 162 Hoonanea St
- 488 Kehaulani St
- 100 Hoonanea St
- 482 Kehaulani St
- 455 Kehaulani St
- 535 Kehaulani St
Your Personal Tour Guide
Ask me questions while you tour the home.