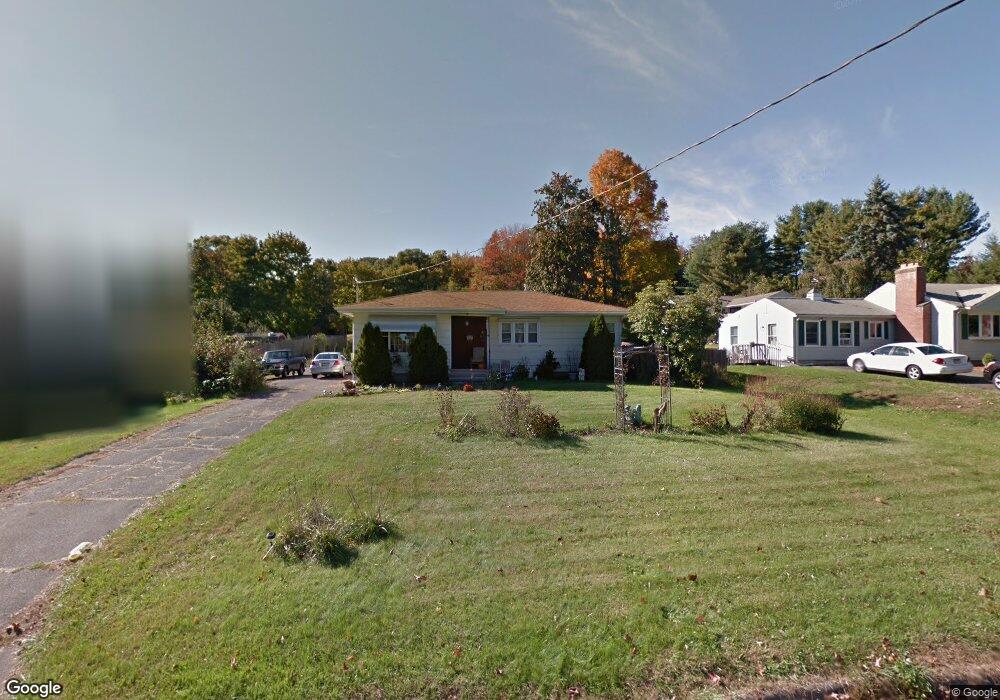
94 Howard Ave Southington, CT 06489
West Southington NeighborhoodEstimated Value: $375,982 - $391,000
3
Beds
1
Bath
1,462
Sq Ft
$264/Sq Ft
Est. Value
About This Home
This home is located at 94 Howard Ave, Southington, CT 06489 and is currently estimated at $385,996, approximately $264 per square foot. 94 Howard Ave is a home located in Hartford County with nearby schools including Urbin T. Kelley Elementary School, Joseph A. Depaolo Middle School, and Southington High School.
Ownership History
Date
Name
Owned For
Owner Type
Purchase Details
Closed on
Jul 30, 2009
Sold by
Maloney Kim M
Bought by
Carter Mary
Current Estimated Value
Home Financials for this Owner
Home Financials are based on the most recent Mortgage that was taken out on this home.
Original Mortgage
$123,000
Interest Rate
5.43%
Purchase Details
Closed on
Sep 23, 1993
Sold by
Ziebka Marie
Bought by
Archacki Kim M
Home Financials for this Owner
Home Financials are based on the most recent Mortgage that was taken out on this home.
Original Mortgage
$120,000
Interest Rate
7.1%
Mortgage Type
Unknown
Create a Home Valuation Report for This Property
The Home Valuation Report is an in-depth analysis detailing your home's value as well as a comparison with similar homes in the area
Home Values in the Area
Average Home Value in this Area
Purchase History
| Date | Buyer | Sale Price | Title Company |
|---|---|---|---|
| Carter Mary | $203,000 | -- | |
| Archacki Kim M | $135,900 | -- |
Source: Public Records
Mortgage History
| Date | Status | Borrower | Loan Amount |
|---|---|---|---|
| Open | Archacki Kim M | $110,000 | |
| Closed | Archacki Kim M | $123,000 | |
| Previous Owner | Archacki Kim M | $95,700 | |
| Previous Owner | Archacki Kim M | $120,000 |
Source: Public Records
Tax History Compared to Growth
Tax History
| Year | Tax Paid | Tax Assessment Tax Assessment Total Assessment is a certain percentage of the fair market value that is determined by local assessors to be the total taxable value of land and additions on the property. | Land | Improvement |
|---|---|---|---|---|
| 2025 | $5,372 | $161,770 | $52,140 | $109,630 |
| 2024 | $5,086 | $161,770 | $52,140 | $109,630 |
| 2023 | $4,911 | $161,770 | $52,140 | $109,630 |
| 2022 | $4,712 | $161,770 | $52,140 | $109,630 |
| 2021 | $4,696 | $161,770 | $52,140 | $109,630 |
| 2020 | $4,602 | $150,250 | $53,210 | $97,040 |
| 2019 | $4,604 | $150,250 | $53,210 | $97,040 |
| 2018 | $4,131 | $135,520 | $53,210 | $82,310 |
| 2017 | $4,131 | $135,520 | $53,210 | $82,310 |
| 2016 | $4,017 | $135,520 | $53,210 | $82,310 |
| 2015 | $4,086 | $140,220 | $50,670 | $89,550 |
| 2014 | $3,977 | $140,220 | $50,670 | $89,550 |
Source: Public Records
Map
Nearby Homes
- 209 W Center St
- 59 Water St
- 500 Mill St Unit 3
- 356 W Center St
- 39 Morningside Ln
- 35 Eden Ave Unit 1
- 92 Berlin Ave
- 45 Hart St
- 76 Kane St
- 84 Empress Dr
- 47 Gannet Dr
- 145 Meriden Ave
- 220 W Main St Unit 2E
- 245 Berlin Ave Unit 6
- 26 Cedar Dr
- 25 Whippoorwill Rd
- 100 Berlin St
- 151 Diana Rd
- 332 Songbird Ln Unit 332
- 67 Dogwood Dr