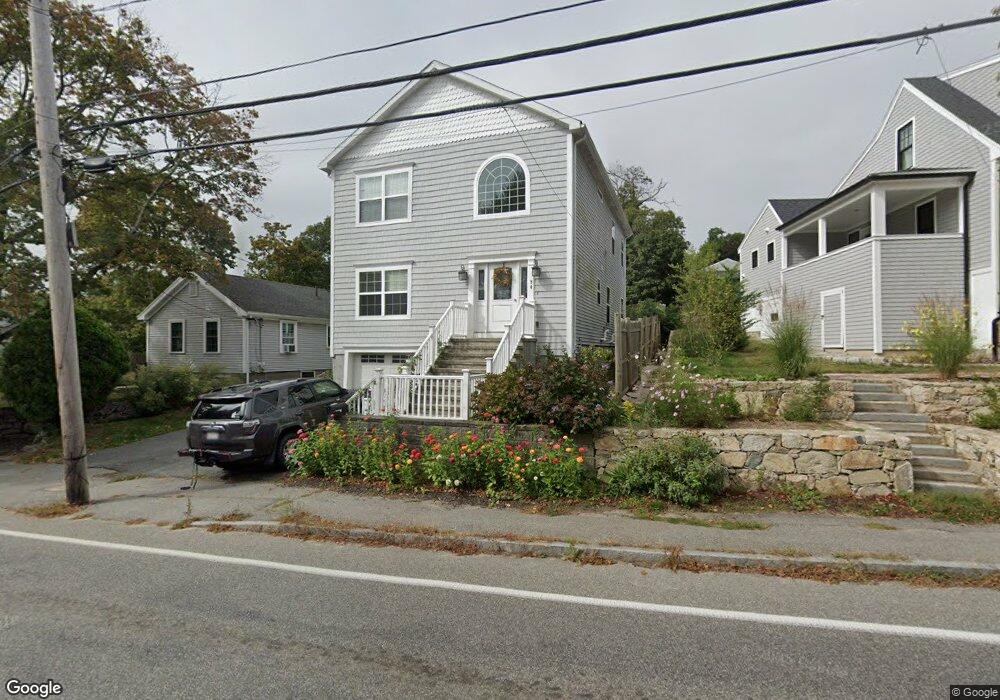
94 Hull St Hingham, MA 02043
Estimated Value: $927,000 - $1,064,000
2
Beds
1
Bath
600
Sq Ft
$1,682/Sq Ft
Est. Value
About This Home
This home is located at 94 Hull St, Hingham, MA 02043 and is currently estimated at $1,009,081, approximately $1,681 per square foot. 94 Hull St is a home located in Plymouth County with nearby schools including East Elementary School, Hingham Middle School, and Hingham High School.
Ownership History
Date
Name
Owned For
Owner Type
Purchase Details
Closed on
Nov 6, 2020
Sold by
Doonan Andrew and Ricci Marisa
Bought by
Depace Michael A and Depace Ashley N
Current Estimated Value
Home Financials for this Owner
Home Financials are based on the most recent Mortgage that was taken out on this home.
Original Mortgage
$510,400
Outstanding Balance
$454,183
Interest Rate
2.8%
Mortgage Type
New Conventional
Estimated Equity
$554,898
Purchase Details
Closed on
Nov 9, 2017
Sold by
Eastern Gate Propertie
Bought by
Doonan Andrew and Ricci Marisa
Home Financials for this Owner
Home Financials are based on the most recent Mortgage that was taken out on this home.
Original Mortgage
$536,750
Interest Rate
3.83%
Mortgage Type
New Conventional
Purchase Details
Closed on
Mar 28, 2014
Sold by
Gilbert Sybilby
Bought by
Eastern Gate Props Llc
Create a Home Valuation Report for This Property
The Home Valuation Report is an in-depth analysis detailing your home's value as well as a comparison with similar homes in the area
Purchase History
| Date | Buyer | Sale Price | Title Company |
|---|---|---|---|
| Depace Michael A | $686,000 | None Available | |
| Doonan Andrew | $565,000 | -- | |
| Eastern Gate Props Llc | $110,000 | -- |
Source: Public Records
Mortgage History
| Date | Status | Borrower | Loan Amount |
|---|---|---|---|
| Open | Depace Michael A | $510,400 | |
| Previous Owner | Doonan Andrew | $536,750 |
Source: Public Records
Tax History
| Year | Tax Paid | Tax Assessment Tax Assessment Total Assessment is a certain percentage of the fair market value that is determined by local assessors to be the total taxable value of land and additions on the property. | Land | Improvement |
|---|---|---|---|---|
| 2025 | $8,725 | $816,200 | $303,700 | $512,500 |
| 2024 | $7,725 | $712,000 | $303,700 | $408,300 |
| 2023 | $6,748 | $674,800 | $282,000 | $392,800 |
| 2022 | $7,431 | $642,800 | $245,800 | $397,000 |
| 2021 | $7,166 | $607,300 | $245,800 | $361,500 |
| 2020 | $7,002 | $607,300 | $245,800 | $361,500 |
| 2019 | $6,893 | $583,700 | $245,800 | $337,900 |
| 2018 | $7,672 | $651,800 | $245,800 | $406,000 |
| 2017 | $5,955 | $486,100 | $239,000 | $247,100 |
| 2016 | $3,055 | $244,600 | $204,800 | $39,800 |
| 2015 | $1,646 | $131,400 | $100,600 | $30,800 |
Source: Public Records
Map
Nearby Homes
- 114 Hull St
- 166 Hull St
- 2 Cliff Rd
- LOT 1B Rockland St
- 14 Cedarledge Village
- 101 Rockland St
- 130 Forest Ave
- 23 Wyola Rd
- 96 Forest Ave
- 8 Evergreen Ln
- 18 Valley Beach Ave
- 1 Rockland St
- 121 Nantasket Ave Unit 503
- 22 Berkley Rd Unit B
- 1 Longbeach Ave Unit 202
- 6 State Park Rd Unit 2
- 4 Atherton Rd
- 181 Atlantic Ave
- 62 Oceanside Dr
- 112 Martins Ln
Your Personal Tour Guide
Ask me questions while you tour the home.