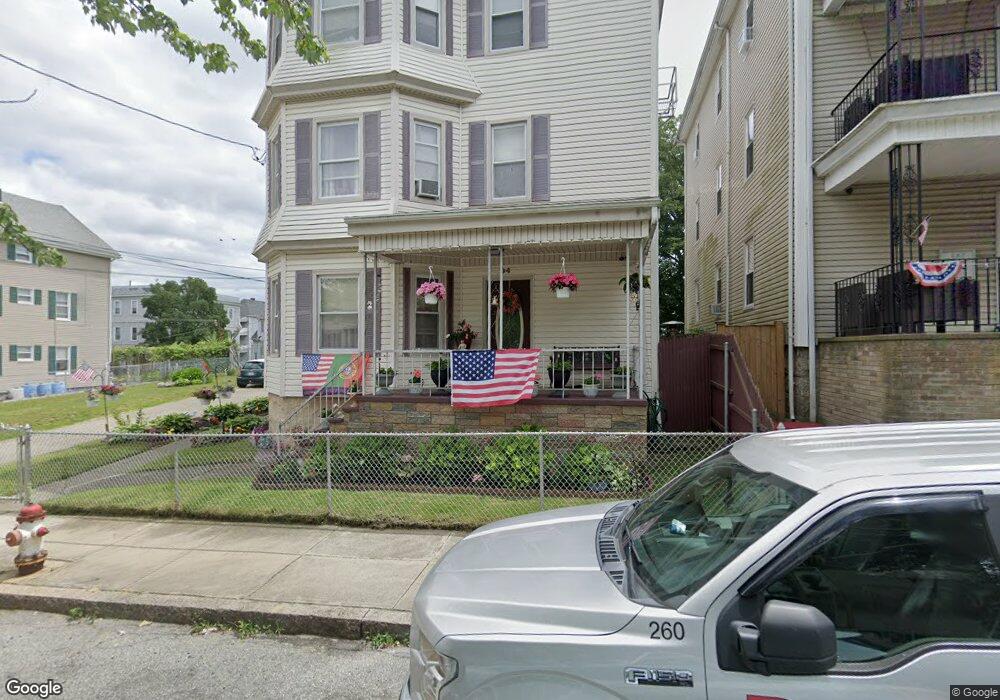
94 Kellogg St Fall River, MA 02724
Father Kelly NeighborhoodEstimated Value: $471,727 - $718,000
9
Beds
3
Baths
3,690
Sq Ft
$156/Sq Ft
Est. Value
About This Home
This home is located at 94 Kellogg St, Fall River, MA 02724 and is currently estimated at $577,182, approximately $156 per square foot. 94 Kellogg St is a home located in Bristol County with nearby schools including Henry Lord Community School, B M C Durfee High School, and Argosy Collegiate Charter School.
Ownership History
Date
Name
Owned For
Owner Type
Purchase Details
Closed on
Jul 31, 1998
Sold by
Roderick Philip J and Roderick Paula M
Bought by
Cabral Hermano M and Cabral Maria I
Current Estimated Value
Home Financials for this Owner
Home Financials are based on the most recent Mortgage that was taken out on this home.
Original Mortgage
$88,000
Outstanding Balance
$17,406
Interest Rate
6.92%
Mortgage Type
Purchase Money Mortgage
Estimated Equity
$559,776
Create a Home Valuation Report for This Property
The Home Valuation Report is an in-depth analysis detailing your home's value as well as a comparison with similar homes in the area
Home Values in the Area
Average Home Value in this Area
Purchase History
| Date | Buyer | Sale Price | Title Company |
|---|---|---|---|
| Cabral Hermano M | $110,000 | -- |
Source: Public Records
Mortgage History
| Date | Status | Borrower | Loan Amount |
|---|---|---|---|
| Open | Cabral Hermano M | $88,000 | |
| Previous Owner | Cabral Hermano M | $116,000 |
Source: Public Records
Tax History
| Year | Tax Paid | Tax Assessment Tax Assessment Total Assessment is a certain percentage of the fair market value that is determined by local assessors to be the total taxable value of land and additions on the property. | Land | Improvement |
|---|---|---|---|---|
| 2025 | $5,414 | $472,800 | $111,300 | $361,500 |
| 2024 | $5,188 | $451,500 | $107,200 | $344,300 |
| 2023 | $4,593 | $374,300 | $88,600 | $285,700 |
| 2022 | $4,110 | $325,700 | $84,300 | $241,400 |
| 2021 | $3,900 | $282,000 | $80,200 | $201,800 |
| 2020 | $3,537 | $244,800 | $79,100 | $165,700 |
| 2019 | $3,056 | $209,600 | $76,100 | $133,500 |
| 2018 | $2,987 | $204,300 | $82,500 | $121,800 |
| 2017 | $2,806 | $200,400 | $78,600 | $121,800 |
| 2016 | $2,761 | $202,600 | $83,600 | $119,000 |
| 2015 | $2,650 | $202,600 | $83,600 | $119,000 |
| 2014 | $2,652 | $210,800 | $81,200 | $129,600 |
Source: Public Records
Map
Nearby Homes
Your Personal Tour Guide
Ask me questions while you tour the home.