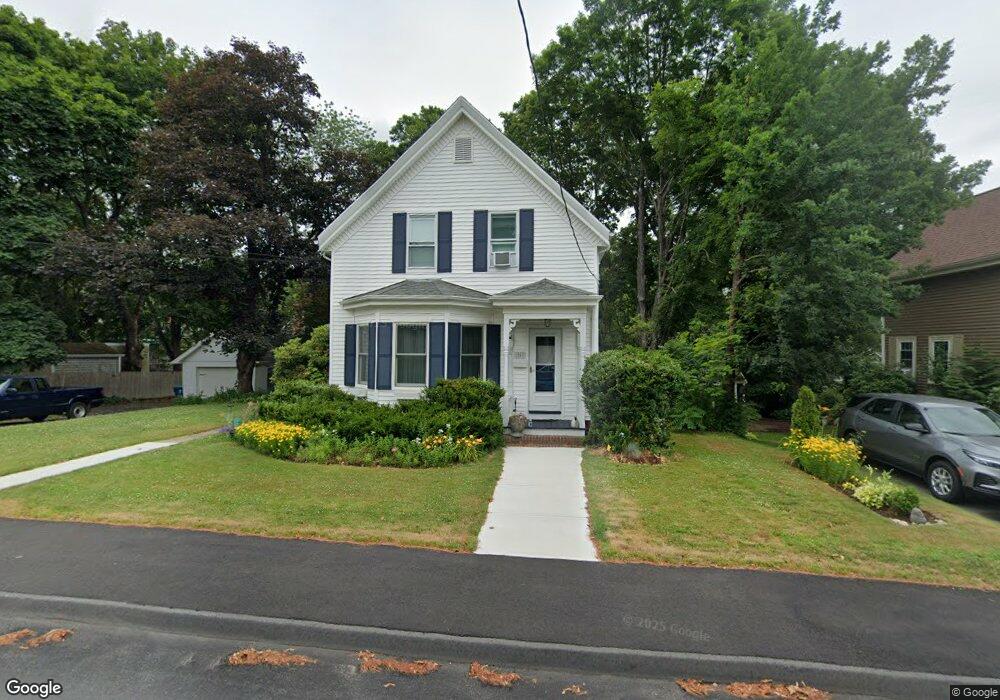
94 Maple Ave East Bridgewater, MA 02333
Estimated Value: $513,705 - $563,000
3
Beds
3
Baths
1,441
Sq Ft
$368/Sq Ft
Est. Value
About This Home
This home is located at 94 Maple Ave, East Bridgewater, MA 02333 and is currently estimated at $530,176, approximately $367 per square foot. 94 Maple Ave is a home located in Plymouth County with nearby schools including Central Elementary School, Gordon W Mitchell Middle School, and East Bridgewater Jr./Sr. High School.
Ownership History
Date
Name
Owned For
Owner Type
Purchase Details
Closed on
Aug 28, 2009
Sold by
Jeremy & Jane Ft
Bought by
Riley John F and Sullivan Courtney L
Current Estimated Value
Home Financials for this Owner
Home Financials are based on the most recent Mortgage that was taken out on this home.
Original Mortgage
$277,000
Outstanding Balance
$180,973
Interest Rate
5.17%
Mortgage Type
Purchase Money Mortgage
Estimated Equity
$349,203
Purchase Details
Closed on
Oct 31, 2003
Sold by
Clark Bradley L and Clark Sheila M
Bought by
Zeoli Raymond F and Zeoli Maureen A
Create a Home Valuation Report for This Property
The Home Valuation Report is an in-depth analysis detailing your home's value as well as a comparison with similar homes in the area
Home Values in the Area
Average Home Value in this Area
Purchase History
| Date | Buyer | Sale Price | Title Company |
|---|---|---|---|
| Riley John F | $289,000 | -- | |
| Zeoli Raymond F | $245,000 | -- |
Source: Public Records
Mortgage History
| Date | Status | Borrower | Loan Amount |
|---|---|---|---|
| Open | Zeoli Raymond F | $277,000 | |
| Previous Owner | Zeoli Raymond F | $220,000 |
Source: Public Records
Tax History Compared to Growth
Tax History
| Year | Tax Paid | Tax Assessment Tax Assessment Total Assessment is a certain percentage of the fair market value that is determined by local assessors to be the total taxable value of land and additions on the property. | Land | Improvement |
|---|---|---|---|---|
| 2025 | $5,145 | $376,400 | $165,600 | $210,800 |
| 2024 | $5,029 | $363,400 | $159,200 | $204,200 |
| 2023 | $4,904 | $339,400 | $159,200 | $180,200 |
| 2022 | $4,961 | $318,000 | $144,800 | $173,200 |
| 2021 | $5,828 | $290,600 | $139,100 | $151,500 |
| 2020 | $4,957 | $286,700 | $133,800 | $152,900 |
| 2019 | $5,575 | $272,200 | $127,900 | $144,300 |
| 2018 | $5,438 | $257,700 | $127,900 | $129,800 |
| 2017 | $0 | $247,300 | $121,900 | $125,400 |
| 2016 | $4,438 | $244,400 | $121,900 | $122,500 |
| 2015 | $4,229 | $238,100 | $121,100 | $117,000 |
| 2014 | $4,124 | $237,400 | $118,600 | $118,800 |
Source: Public Records
Map
Nearby Homes
- 41 Bedford St
- 71 Church St
- 22 Water St
- 11 Harmony Crossing
- 11 Willow Ave
- 386 Bedford St
- 391 Bedford St
- 282 Spring St
- 261 Plymouth St
- 14 Mountain Ash Rd
- 407 W Union St
- 78 Crystal Water Dr
- 505 N Central St
- 455 Plymouth St
- 590 Bedford St
- 1 Simmons Place
- 217 Crystal Water Dr
- 585 N Bedford St
- 182 Crystal Water Dr Unit 182
- 416 Highland St