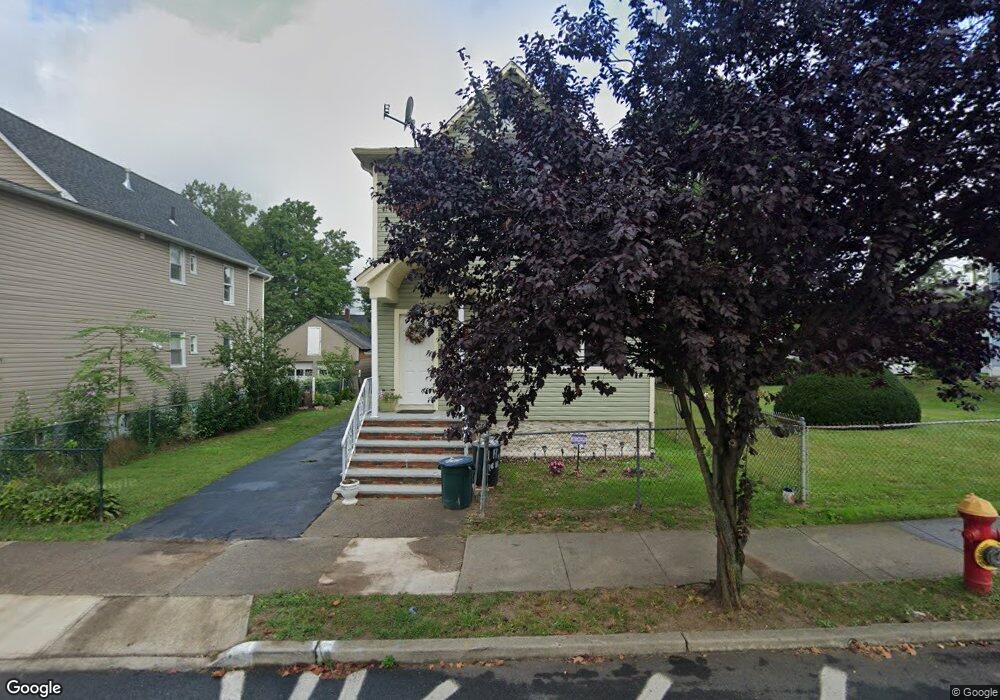
94 Monhegan St Unit 2 Clifton, NJ 07013
Athenia NeighborhoodEstimated Value: $542,000 - $697,000
2
Beds
1
Bath
1,520
Sq Ft
$408/Sq Ft
Est. Value
About This Home
This home is located at 94 Monhegan St Unit 2, Clifton, NJ 07013 and is currently estimated at $620,201, approximately $408 per square foot. 94 Monhegan St Unit 2 is a home located in Passaic County with nearby schools including Clifton High School, St Andrew Elementary School, and St. John Kanty Elementary School.
Ownership History
Date
Name
Owned For
Owner Type
Purchase Details
Closed on
Feb 4, 2002
Sold by
Concodora Clement
Bought by
Franco Thelma and Valerio Umberthen
Current Estimated Value
Home Financials for this Owner
Home Financials are based on the most recent Mortgage that was taken out on this home.
Original Mortgage
$198,731
Interest Rate
6.91%
Mortgage Type
FHA
Create a Home Valuation Report for This Property
The Home Valuation Report is an in-depth analysis detailing your home's value as well as a comparison with similar homes in the area
Home Values in the Area
Average Home Value in this Area
Purchase History
| Date | Buyer | Sale Price | Title Company |
|---|---|---|---|
| Franco Thelma | $206,100 | -- |
Source: Public Records
Mortgage History
| Date | Status | Borrower | Loan Amount |
|---|---|---|---|
| Previous Owner | Franco Thelma | $198,731 |
Source: Public Records
Tax History Compared to Growth
Tax History
| Year | Tax Paid | Tax Assessment Tax Assessment Total Assessment is a certain percentage of the fair market value that is determined by local assessors to be the total taxable value of land and additions on the property. | Land | Improvement |
|---|---|---|---|---|
| 2025 | $9,064 | $152,700 | $83,000 | $69,700 |
| 2024 | $8,847 | $152,700 | $83,000 | $69,700 |
| 2022 | $8,719 | $152,700 | $83,000 | $69,700 |
| 2021 | $8,360 | $152,700 | $83,000 | $69,700 |
| 2020 | $8,388 | $152,700 | $83,000 | $69,700 |
| 2019 | $8,328 | $152,700 | $83,000 | $69,700 |
| 2018 | $8,281 | $152,700 | $83,000 | $69,700 |
| 2017 | $8,191 | $152,700 | $83,000 | $69,700 |
| 2016 | $8,032 | $152,700 | $83,000 | $69,700 |
| 2015 | $7,954 | $152,700 | $83,000 | $69,700 |
| 2014 | $7,791 | $152,700 | $83,000 | $69,700 |
Source: Public Records
Map
Nearby Homes