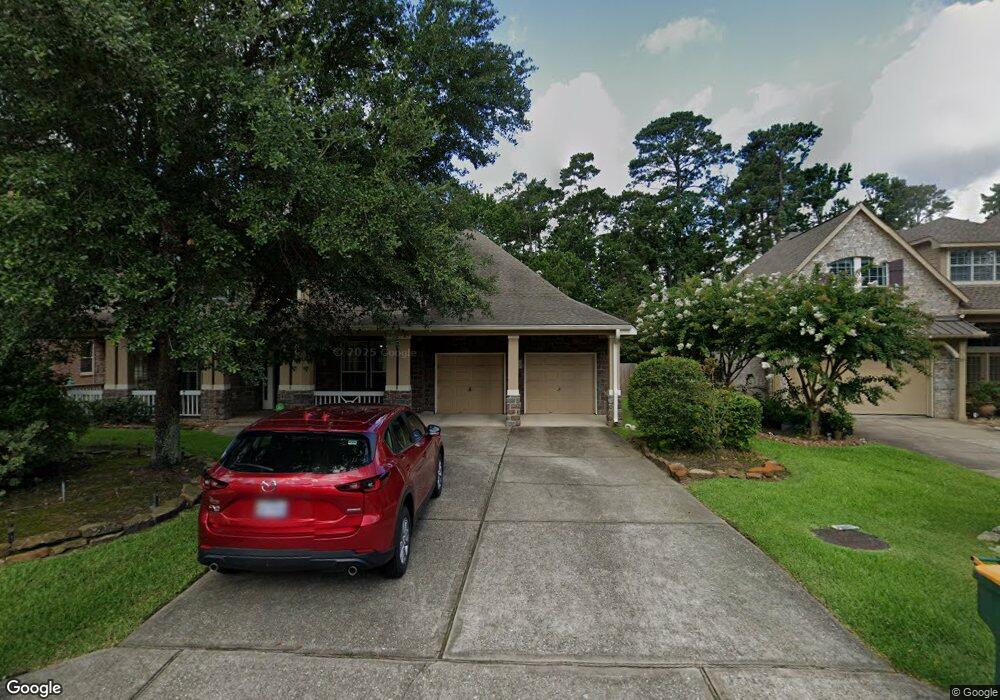
94 N Lansdowne Cir Spring, TX 77382
Indian Springs NeighborhoodEstimated Value: $965,000 - $1,035,000
4
Beds
4
Baths
3,894
Sq Ft
$259/Sq Ft
Est. Value
About This Home
This home is located at 94 N Lansdowne Cir, Spring, TX 77382 and is currently estimated at $1,007,015, approximately $258 per square foot. 94 N Lansdowne Cir is a home located in Montgomery County with nearby schools including Tough Elementary School, McCullough Junior High School, and The Woodlands High School.
Ownership History
Date
Name
Owned For
Owner Type
Purchase Details
Closed on
Nov 14, 2014
Sold by
Tanner Jeffrey A and Tanner Natalie S
Bought by
Sosa Enrique and Montalvo Lucia Lorena
Current Estimated Value
Home Financials for this Owner
Home Financials are based on the most recent Mortgage that was taken out on this home.
Original Mortgage
$484,000
Outstanding Balance
$349,179
Interest Rate
2.5%
Mortgage Type
Adjustable Rate Mortgage/ARM
Estimated Equity
$657,836
Purchase Details
Closed on
Dec 27, 2013
Sold by
Bub Scott R and Bub Kathryn R
Bought by
Tanner Jeffery A and Tanner Natalie S
Home Financials for this Owner
Home Financials are based on the most recent Mortgage that was taken out on this home.
Original Mortgage
$180,000
Interest Rate
4.34%
Mortgage Type
New Conventional
Purchase Details
Closed on
Jun 12, 2002
Sold by
Weekley Homes Lp
Bought by
Bub Scott R and Bub Kathryn R
Home Financials for this Owner
Home Financials are based on the most recent Mortgage that was taken out on this home.
Original Mortgage
$299,600
Interest Rate
5.62%
Mortgage Type
Purchase Money Mortgage
Create a Home Valuation Report for This Property
The Home Valuation Report is an in-depth analysis detailing your home's value as well as a comparison with similar homes in the area
Home Values in the Area
Average Home Value in this Area
Purchase History
| Date | Buyer | Sale Price | Title Company |
|---|---|---|---|
| Sosa Enrique | -- | Old Republic Title | |
| Tanner Jeffery A | -- | None Available | |
| Bub Scott R | -- | Priority Title Company |
Source: Public Records
Mortgage History
| Date | Status | Borrower | Loan Amount |
|---|---|---|---|
| Open | Sosa Enrique | $484,000 | |
| Previous Owner | Tanner Jeffery A | $180,000 | |
| Previous Owner | Bub Scott R | $299,600 |
Source: Public Records
Tax History Compared to Growth
Tax History
| Year | Tax Paid | Tax Assessment Tax Assessment Total Assessment is a certain percentage of the fair market value that is determined by local assessors to be the total taxable value of land and additions on the property. | Land | Improvement |
|---|---|---|---|---|
| 2025 | $12,644 | $872,829 | $120,000 | $752,829 |
| 2024 | $11,502 | $816,255 | -- | -- |
| 2023 | $11,502 | $742,050 | $120,000 | $689,000 |
| 2022 | $13,403 | $674,590 | $120,000 | $600,000 |
| 2021 | $13,074 | $613,260 | $60,000 | $553,260 |
| 2020 | $13,695 | $613,260 | $60,000 | $553,260 |
| 2019 | $13,521 | $586,150 | $60,000 | $526,150 |
| 2018 | $12,384 | $586,150 | $60,000 | $526,150 |
| 2017 | $14,833 | $634,970 | $60,000 | $574,970 |
| 2016 | $14,833 | $634,970 | $60,000 | $574,970 |
| 2015 | $13,827 | $610,760 | $60,000 | $550,760 |
| 2014 | $13,827 | $579,800 | $60,000 | $519,800 |
Source: Public Records
Map
Nearby Homes
- 187 E Lansdowne Cir
- 62 N Altwood Cir
- 62 W Mirror Ridge Cir
- 58 S Longsford Cir
- 82 S Longsford Cir
- 30 W Bracebridge Cir
- 11 Bracebridge Dr
- 10 N Longsford Cir
- 39 W Bracebridge Cir
- 2 Peony Springs Ct
- 14 E Thymewood Place
- 137 Cheswood Manor Dr
- 91 Palmiera Dr
- 58 W Shale Creek Cir
- 14 N Palmiera Cir
- 11 Bunnelle Way
- 7519 Red Bay Cir
- 11 Scenic Brook Ct
- 7 Coverdell Park
- 6 Eagle Rise Place
- 98 W Lansdowne Cir
- 90 W Lansdowne Cir
- 95 Lansdown
- 102 W Lansdowne Cir
- 102 N Lansdowne Cir
- 95 W Lansdowne Cir
- 99 W Lansdowne Cir
- 86 W Lansdowne Cir
- 91 W Lansdowne Cir
- 106 W Lansdowne Cir
- 103 W Lansdowne Cir
- 87 W Lansdowne Cir
- 82 W Lansdowne Cir
- 19 Meadow Rose Place
- 107 W Lansdowne Cir
- 23 Meadow Rose Place
- 110 W Lansdowne Cir
- 79 W Lansdowne Cir
- 15 Meadow Rose Place
- 27 Meadow Rose Place