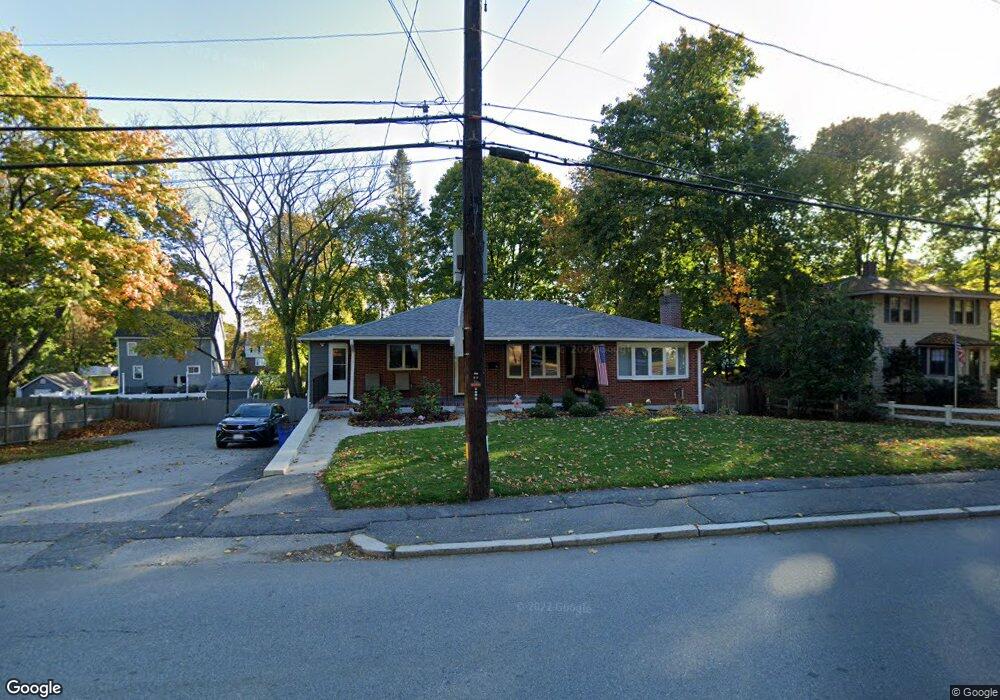
94 North St Stoneham, MA 02180
Lindenwood NeighborhoodEstimated Value: $894,000 - $1,009,000
4
Beds
3
Baths
2,706
Sq Ft
$344/Sq Ft
Est. Value
About This Home
This home is located at 94 North St, Stoneham, MA 02180 and is currently estimated at $929,840, approximately $343 per square foot. 94 North St is a home located in Middlesex County with nearby schools including Stoneham High School, St. Patrick Elementary School, and St Joseph School.
Ownership History
Date
Name
Owned For
Owner Type
Purchase Details
Closed on
Jul 12, 2000
Sold by
Adamo Tina
Bought by
Hansen Ronald A and Hansen Rosann M
Current Estimated Value
Home Financials for this Owner
Home Financials are based on the most recent Mortgage that was taken out on this home.
Original Mortgage
$252,700
Interest Rate
8.5%
Mortgage Type
Purchase Money Mortgage
Create a Home Valuation Report for This Property
The Home Valuation Report is an in-depth analysis detailing your home's value as well as a comparison with similar homes in the area
Home Values in the Area
Average Home Value in this Area
Purchase History
| Date | Buyer | Sale Price | Title Company |
|---|---|---|---|
| Hansen Ronald A | $297,400 | -- |
Source: Public Records
Mortgage History
| Date | Status | Borrower | Loan Amount |
|---|---|---|---|
| Open | Hansen Rosann M | $113,000 | |
| Open | Hansen Ronald A | $330,000 | |
| Closed | Hansen Ronald A | $329,925 | |
| Closed | Hansen Ronald A | $70,000 | |
| Closed | Hansen Rosann M | $272,000 | |
| Closed | Hansen Ronald A | $272,000 | |
| Closed | Hansen Ronald A | $252,200 | |
| Closed | Hansen Ronald A | $252,700 |
Source: Public Records
Tax History Compared to Growth
Tax History
| Year | Tax Paid | Tax Assessment Tax Assessment Total Assessment is a certain percentage of the fair market value that is determined by local assessors to be the total taxable value of land and additions on the property. | Land | Improvement |
|---|---|---|---|---|
| 2025 | $7,706 | $753,300 | $380,900 | $372,400 |
| 2024 | $7,441 | $702,600 | $350,900 | $351,700 |
| 2023 | $7,309 | $658,500 | $320,900 | $337,600 |
| 2022 | $6,469 | $621,400 | $300,900 | $320,500 |
| 2021 | $9,472 | $586,900 | $280,900 | $306,000 |
| 2020 | $6,340 | $587,600 | $280,900 | $306,700 |
| 2019 | $4,397 | $551,900 | $260,900 | $291,000 |
| 2018 | $5,807 | $495,900 | $230,900 | $265,000 |
| 2017 | $5,699 | $460,000 | $230,900 | $229,100 |
| 2016 | $5,425 | $427,200 | $215,900 | $211,300 |
| 2015 | $5,303 | $409,200 | $215,900 | $193,300 |
| 2014 | $5,106 | $378,500 | $205,900 | $172,600 |
Source: Public Records
Map
Nearby Homes
- 89 North St
- 64 Main St Unit 34B
- 66 Main St Unit 37A
- 66 Main St Unit 58A
- 36 Abigail Way Unit 4003
- 122 Main St Unit 402
- 62 Abigail Way Unit 2007
- 62 Abigail Way Unit 2003
- 57 Augustus Ct Unit 1013
- 313 South St
- 159 Main St Unit 39A
- 159 Main St Unit . 45C
- 11 Coventry Ln
- 62 High St Unit Lot 2
- 62 High St Unit Lot 5
- 62 High St Unit Lot 8
- 62 High St Unit Lot 1
- 62 High St Unit 4
- 62 High St Unit Lot 9
- 62 High St Unit Lot 11