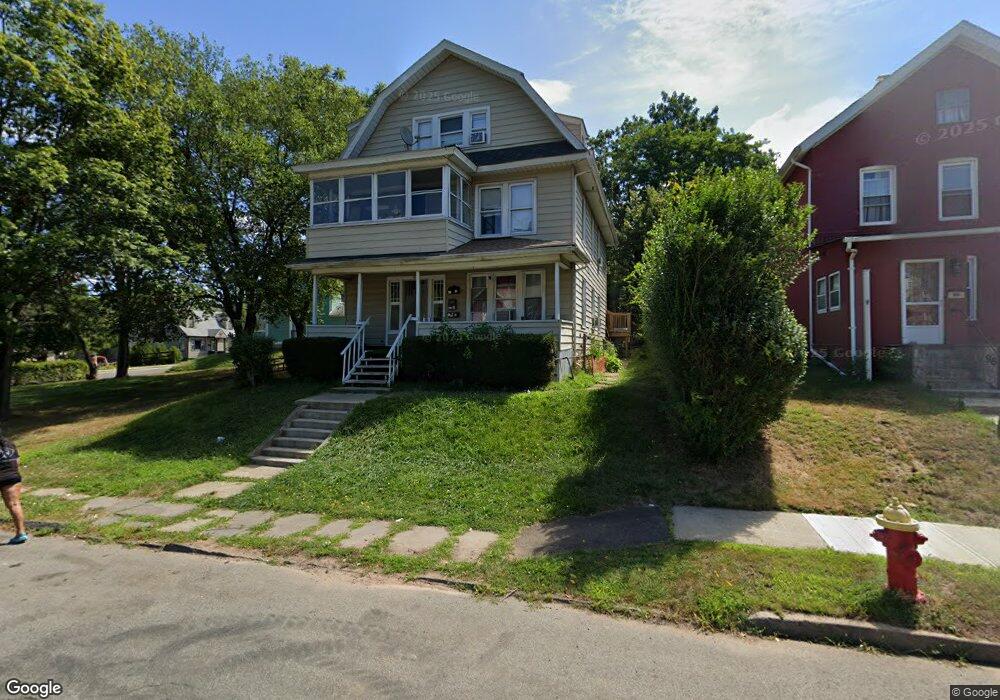
94 Oak St Meriden, CT 06450
Estimated Value: $267,106 - $405,000
6
Beds
3
Baths
2,340
Sq Ft
$146/Sq Ft
Est. Value
About This Home
This home is located at 94 Oak St, Meriden, CT 06450 and is currently estimated at $342,527, approximately $146 per square foot. 94 Oak St is a home located in New Haven County with nearby schools including Casimir Pulaski School, Washington Middle School, and Francis T. Maloney High School.
Ownership History
Date
Name
Owned For
Owner Type
Purchase Details
Closed on
Jun 30, 2009
Sold by
Formica Sebastian M and Formica Sophie A
Bought by
Fiut Tricia A and Guyer Jennifer D
Current Estimated Value
Home Financials for this Owner
Home Financials are based on the most recent Mortgage that was taken out on this home.
Original Mortgage
$141,882
Outstanding Balance
$90,749
Interest Rate
4.92%
Mortgage Type
Commercial
Estimated Equity
$251,778
Purchase Details
Closed on
May 7, 2004
Sold by
Selimaj Isat
Bought by
Djonbaljaj Sulja
Purchase Details
Closed on
Nov 6, 2003
Sold by
Spanauer Kenneth C and Spanauer Paula M
Bought by
Djonbaljaj Sulja and Selimaj Isat
Home Financials for this Owner
Home Financials are based on the most recent Mortgage that was taken out on this home.
Original Mortgage
$144,000
Interest Rate
6.01%
Create a Home Valuation Report for This Property
The Home Valuation Report is an in-depth analysis detailing your home's value as well as a comparison with similar homes in the area
Home Values in the Area
Average Home Value in this Area
Purchase History
| Date | Buyer | Sale Price | Title Company |
|---|---|---|---|
| Fiut Tricia A | $144,500 | -- | |
| Djonbaljaj Sulja | $77,000 | -- | |
| Djonbaljaj Sulja | $160,000 | -- |
Source: Public Records
Mortgage History
| Date | Status | Borrower | Loan Amount |
|---|---|---|---|
| Open | Djonbaljaj Sulja | $141,882 | |
| Previous Owner | Djonbaljaj Sulja | $144,000 | |
| Previous Owner | Djonbaljaj Sulja | $130,000 |
Source: Public Records
Tax History Compared to Growth
Tax History
| Year | Tax Paid | Tax Assessment Tax Assessment Total Assessment is a certain percentage of the fair market value that is determined by local assessors to be the total taxable value of land and additions on the property. | Land | Improvement |
|---|---|---|---|---|
| 2024 | $5,335 | $138,530 | $38,640 | $99,890 |
| 2023 | $5,142 | $138,530 | $38,640 | $99,890 |
| 2022 | $4,851 | $138,530 | $38,640 | $99,890 |
| 2021 | $5,067 | $116,410 | $43,890 | $72,520 |
| 2020 | $5,053 | $116,410 | $43,890 | $72,520 |
| 2019 | $5,010 | $116,410 | $43,890 | $72,520 |
| 2018 | $5,030 | $116,410 | $43,890 | $72,520 |
| 2017 | $4,896 | $116,410 | $43,890 | $72,520 |
| 2016 | $4,489 | $115,780 | $34,160 | $81,620 |
| 2015 | $4,489 | $115,780 | $34,160 | $81,620 |
| 2014 | $4,380 | $115,780 | $34,160 | $81,620 |
Source: Public Records
Map
Nearby Homes