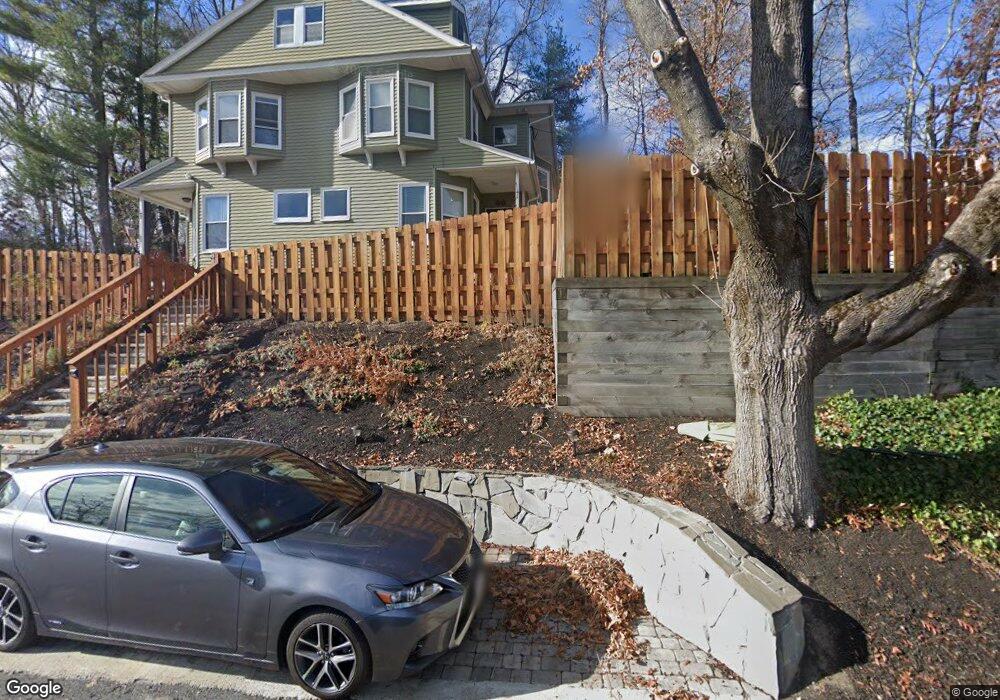
94 Poor St Andover, MA 01810
Shawsheen Heights NeighborhoodEstimated Value: $818,000 - $1,198,000
6
Beds
2
Baths
3,524
Sq Ft
$283/Sq Ft
Est. Value
About This Home
This home is located at 94 Poor St, Andover, MA 01810 and is currently estimated at $996,505, approximately $282 per square foot. 94 Poor St is a home located in Essex County with nearby schools including West Elementary School, Andover West Middle School, and Andover High School.
Ownership History
Date
Name
Owned For
Owner Type
Purchase Details
Closed on
Jul 3, 2002
Sold by
Richard Pierre and Svenson Kristine
Bought by
Chopra Ragiv and Chopra Sabida
Current Estimated Value
Home Financials for this Owner
Home Financials are based on the most recent Mortgage that was taken out on this home.
Original Mortgage
$244,000
Interest Rate
6.82%
Purchase Details
Closed on
Mar 30, 1993
Sold by
Starrett David P
Bought by
Walter Wendy J
Purchase Details
Closed on
Nov 14, 1988
Sold by
Harding Donald J
Bought by
Starrett David P
Create a Home Valuation Report for This Property
The Home Valuation Report is an in-depth analysis detailing your home's value as well as a comparison with similar homes in the area
Home Values in the Area
Average Home Value in this Area
Purchase History
| Date | Buyer | Sale Price | Title Company |
|---|---|---|---|
| Chopra Ragiv | $299,000 | -- | |
| Chopra Ragiv | $299,000 | -- | |
| Walter Wendy J | $228,000 | -- | |
| Walter Wendy J | $228,000 | -- | |
| Starrett David P | $225,500 | -- |
Source: Public Records
Mortgage History
| Date | Status | Borrower | Loan Amount |
|---|---|---|---|
| Open | Starrett David P | $150,000 | |
| Closed | Starrett David P | $244,000 |
Source: Public Records
Tax History
| Year | Tax Paid | Tax Assessment Tax Assessment Total Assessment is a certain percentage of the fair market value that is determined by local assessors to be the total taxable value of land and additions on the property. | Land | Improvement |
|---|---|---|---|---|
| 2024 | $11,583 | $899,300 | $480,100 | $419,200 |
| 2023 | $11,630 | $851,400 | $432,500 | $418,900 |
| 2022 | $10,738 | $735,500 | $382,800 | $352,700 |
| 2021 | $10,266 | $671,400 | $347,900 | $323,500 |
| 2020 | $9,641 | $642,300 | $339,500 | $302,800 |
| 2019 | $9,186 | $601,600 | $326,300 | $275,300 |
| 2018 | $8,774 | $561,000 | $307,700 | $253,300 |
| 2017 | $7,935 | $522,700 | $301,600 | $221,100 |
| 2016 | $7,278 | $491,100 | $301,600 | $189,500 |
| 2015 | $7,180 | $479,600 | $290,100 | $189,500 |
Source: Public Records
Map
Nearby Homes
- 354 N Main St Unit 204
- 42 York St
- 34 Martingale Ln Unit 34
- 10 Dartmouth Rd
- 53 Martingale Ln
- 16 Balmoral St Unit 214
- 116 Weare St
- 17 Carisbrooke St
- 12B Stevens St
- 21 Clubview Dr Unit 21
- 43 Gorham St
- 40C Washington Park Dr Unit 12
- 70 Washington Park Dr Unit 6
- 24 Inman St Unit 4
- 341 S Broadway- Parcel II
- 11 Swan Ln Unit 11
- 11 W Hawley St
- 16R High St
- 1 Longwood Dr Unit 109
- 3 Longwood Dr Unit 107
- 96 Poor St
- 94-96 Poor St
- 4 Ferndale Ave
- 394 N Main St
- 90 Poor St
- 6 Ferndale Ave Unit 2
- 398 N Main St Unit 1L
- 398 N Main St Unit 2L
- 93 Poor St
- 8 Ferndale Ave
- 10 Ferndale Ave
- 88 Poor St
- 392 N Main St
- 3 Ferndale Ave
- 35 Magnolia Ave
- 31 Magnolia Ave
- 5 Ferndale Ave
- 51 Magnolia Ave
- 27 Magnolia Ave
- 86 Poor St
Your Personal Tour Guide
Ask me questions while you tour the home.