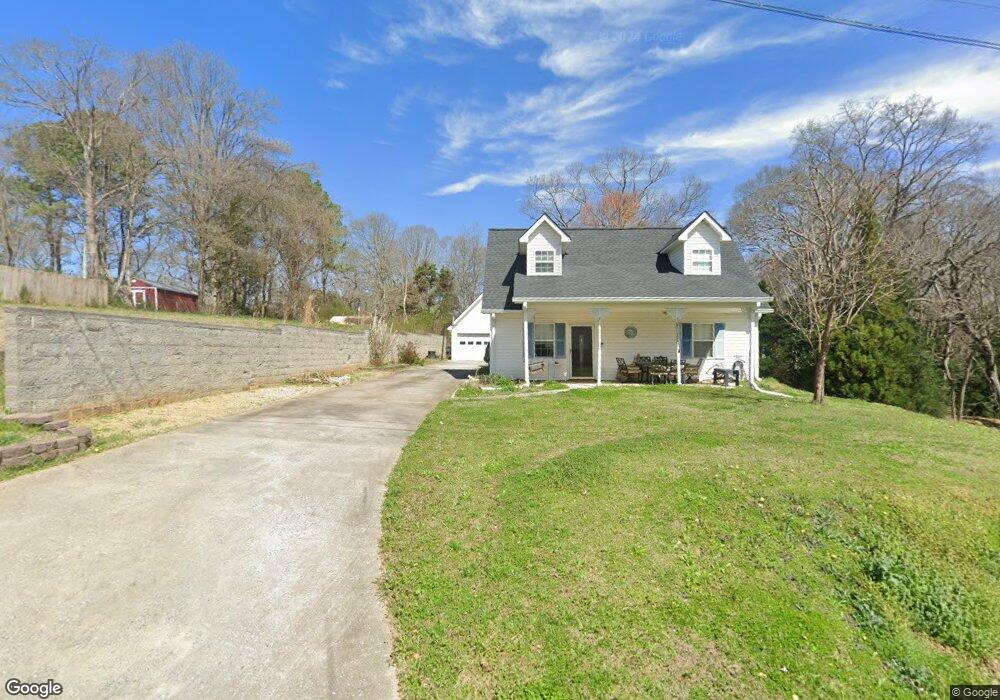
94 Rhubarb Ln Tallapoosa, GA 30176
Estimated Value: $197,000 - $216,000
3
Beds
2
Baths
1,212
Sq Ft
$170/Sq Ft
Est. Value
About This Home
This home is located at 94 Rhubarb Ln, Tallapoosa, GA 30176 and is currently estimated at $205,487, approximately $169 per square foot. 94 Rhubarb Ln is a home located in Haralson County with nearby schools including Haralson County High School.
Ownership History
Date
Name
Owned For
Owner Type
Purchase Details
Closed on
Nov 16, 2020
Sold by
Ross Erick J
Bought by
White David and White Jean
Current Estimated Value
Purchase Details
Closed on
Sep 1, 2020
Sold by
Daniel John W
Bought by
Ross Erick J and Ross Terisa M
Home Financials for this Owner
Home Financials are based on the most recent Mortgage that was taken out on this home.
Original Mortgage
$83,932
Interest Rate
2.8%
Mortgage Type
New Conventional
Purchase Details
Closed on
Jan 29, 2008
Sold by
Daniel Joy E
Bought by
Daniel John W and Daniel Janice
Purchase Details
Closed on
Jun 15, 2001
Sold by
Mark Richard and Mark Krise
Bought by
Daniel Joy E
Purchase Details
Closed on
Oct 12, 1998
Sold by
Downey Marilyn G and Downey R
Bought by
Mark Richard and Mark Krise
Purchase Details
Closed on
Sep 8, 1998
Sold by
Downey Robert A
Bought by
Downey Marilyn G and Downey R
Purchase Details
Closed on
Mar 27, 1998
Sold by
Mann Doris E
Bought by
Downey Robert A
Purchase Details
Closed on
Mar 31, 1977
Sold by
Cole Wayne and Mann Jp
Bought by
Mann Doris E
Create a Home Valuation Report for This Property
The Home Valuation Report is an in-depth analysis detailing your home's value as well as a comparison with similar homes in the area
Home Values in the Area
Average Home Value in this Area
Purchase History
| Date | Buyer | Sale Price | Title Company |
|---|---|---|---|
| White David | $139,000 | -- | |
| Ross Erick J | $95,000 | -- | |
| Daniel John W | -- | -- | |
| Daniel Joy E | $75,900 | -- | |
| Mark Richard | $68,900 | -- | |
| Downey Marilyn G | -- | -- | |
| Downey Robert A | $3,600 | -- | |
| Mann Doris E | $1,000 | -- |
Source: Public Records
Mortgage History
| Date | Status | Borrower | Loan Amount |
|---|---|---|---|
| Previous Owner | Ross Erick J | $83,932 |
Source: Public Records
Tax History Compared to Growth
Tax History
| Year | Tax Paid | Tax Assessment Tax Assessment Total Assessment is a certain percentage of the fair market value that is determined by local assessors to be the total taxable value of land and additions on the property. | Land | Improvement |
|---|---|---|---|---|
| 2024 | $1,562 | $58,444 | $5,457 | $52,987 |
| 2023 | $838 | $61,253 | $4,845 | $56,408 |
| 2022 | $1,021 | $50,671 | $4,845 | $45,826 |
| 2021 | $1,256 | $48,603 | $4,845 | $43,758 |
| 2020 | $1,299 | $48,042 | $4,845 | $43,197 |
| 2019 | $1,278 | $45,538 | $4,845 | $40,693 |
| 2018 | $1,293 | $45,538 | $4,845 | $40,693 |
| 2017 | $1,230 | $39,525 | $4,845 | $34,680 |
| 2016 | $1,048 | $35,953 | $4,845 | $31,108 |
| 2015 | $1,053 | $35,934 | $4,845 | $31,090 |
| 2014 | $1,134 | $37,567 | $5,700 | $31,867 |
Source: Public Records
Map
Nearby Homes
- 267 Williams St
- 2633 Georgia 120 (485 53 Acres)
- 75 Rose St
- 0 W Mill St Unit 10604030
- 0 W Mill St Unit 7649366
- 281 Alewine Ave
- 4493 Stone Mountain St
- 250 Kiker St
- 244 Monroe St
- 117 White St
- 0 Broad St Unit 10614514
- 0 Broad St Unit 10614479
- 0 Georgia 120 Unit 7646686
- 0 Georgia 120 Unit 10600882
- 438 Bowdon St
- 0 Stone Mountain St Unit 24639770
- 0 Stone Mountain St Unit 10465113
- 20 S Kelley St
- 124 S Kelley St
- 0 Providence Lake Rd Unit 10576961
- 0 Rhubarb Ln Unit 8426407
- 0 Rhubarb Ln
- 0 Rhubarb Ln Unit 8883229
- 86 Rhubarb Ln
- 0 Stokes St Unit 7027866
- 0 Stokes St Unit 8675333
- 0 Stokes St Unit 8418073
- 0 Stokes St
- 139 Stokes St
- 139 Stokes St
- 91 Rhubarb Ln
- 175 Stokes St
- 172 Stokes St
- 94 Ann St
- 140 Williams St
- 227 Williams St
- 70 Rhubarb Ln
- 131 Freeman St
- 117 Stokes St
- 161 Williams St