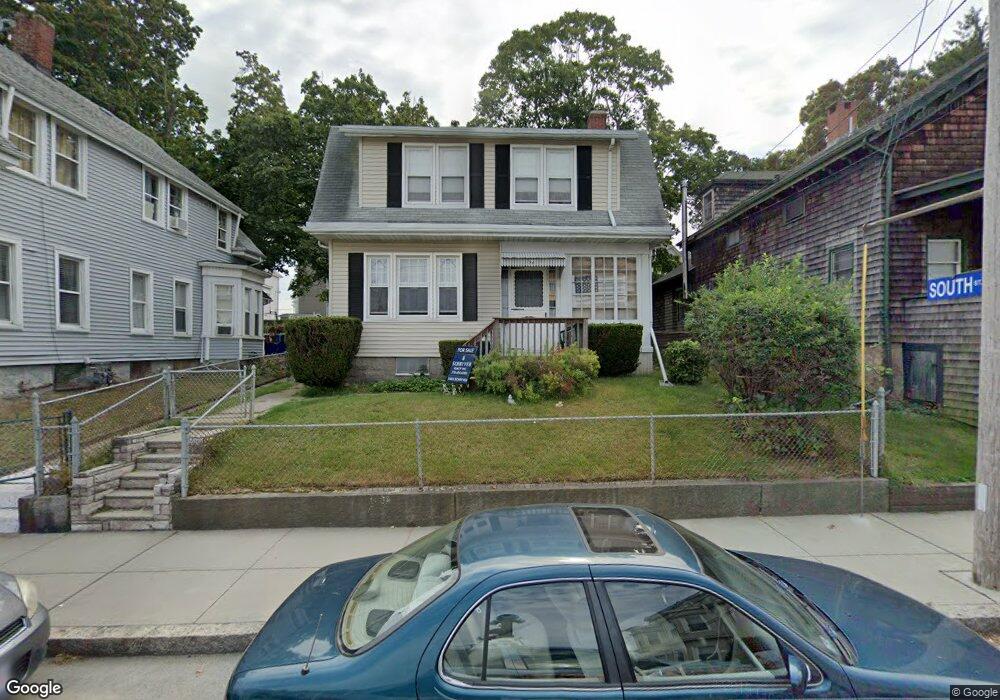
94 Ridge St Fall River, MA 02721
Corky Row NeighborhoodEstimated Value: $348,000 - $498,000
4
Beds
2
Baths
1,532
Sq Ft
$260/Sq Ft
Est. Value
About This Home
This home is located at 94 Ridge St, Fall River, MA 02721 and is currently estimated at $398,675, approximately $260 per square foot. 94 Ridge St is a home located in Bristol County with nearby schools including Henry Lord Community School, B M C Durfee High School, and Argosy Collegiate Charter School.
Ownership History
Date
Name
Owned For
Owner Type
Purchase Details
Closed on
Aug 22, 2003
Sold by
Bolger James M and Bolger Stephen J
Bought by
Bolger James M and Nobrega Leslie J
Current Estimated Value
Home Financials for this Owner
Home Financials are based on the most recent Mortgage that was taken out on this home.
Original Mortgage
$70,000
Outstanding Balance
$30,601
Interest Rate
5.52%
Mortgage Type
Purchase Money Mortgage
Estimated Equity
$368,074
Create a Home Valuation Report for This Property
The Home Valuation Report is an in-depth analysis detailing your home's value as well as a comparison with similar homes in the area
Home Values in the Area
Average Home Value in this Area
Purchase History
| Date | Buyer | Sale Price | Title Company |
|---|---|---|---|
| Bolger James M | -- | -- |
Source: Public Records
Mortgage History
| Date | Status | Borrower | Loan Amount |
|---|---|---|---|
| Open | Bolger James M | $70,000 | |
| Previous Owner | Bolger James M | $25,000 |
Source: Public Records
Tax History
| Year | Tax Paid | Tax Assessment Tax Assessment Total Assessment is a certain percentage of the fair market value that is determined by local assessors to be the total taxable value of land and additions on the property. | Land | Improvement |
|---|---|---|---|---|
| 2025 | $3,658 | $319,500 | $106,000 | $213,500 |
| 2024 | $3,422 | $297,800 | $102,100 | $195,700 |
| 2023 | $3,314 | $270,100 | $84,400 | $185,700 |
| 2022 | $2,961 | $234,600 | $80,400 | $154,200 |
| 2021 | $2,903 | $209,900 | $76,500 | $133,400 |
| 2020 | $2,891 | $200,100 | $75,300 | $124,800 |
| 2019 | $2,805 | $192,400 | $72,600 | $119,800 |
| 2018 | $2,759 | $188,700 | $78,600 | $110,100 |
| 2017 | $2,563 | $183,100 | $74,900 | $108,200 |
| 2016 | $2,472 | $181,400 | $79,700 | $101,700 |
| 2015 | $2,373 | $181,400 | $79,700 | $101,700 |
| 2014 | $2,253 | $179,100 | $77,400 | $101,700 |
Source: Public Records
Map
Nearby Homes
- 82 Ridge St
- 74 Ridge St
- 79 Whipple St
- 114 Ridge St
- 114 Ridge St Unit 2
- 99 Ridge St
- 67 Whipple St
- 60 Ridge St
- 45,49,53 Whipple St
- 101 Whipple St
- 44 South St
- 126 Ridge St
- 57 Whipple St
- 109 Whipple St
- 109 Whipple St Unit 3
- 109 Whipple St Unit 2
- 111 Ridge St
- 111 Ridge St Unit 2
- 134 Ridge St
- 53 Whipple St
Your Personal Tour Guide
Ask me questions while you tour the home.