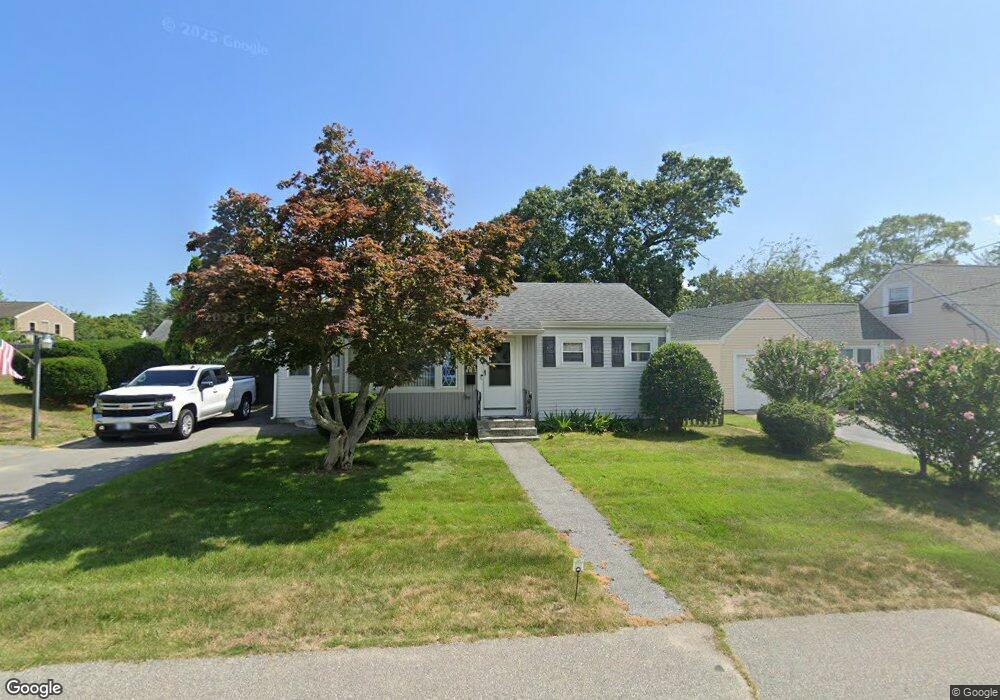
94 Royland Rd Warwick, RI 02889
Hoxie NeighborhoodEstimated Value: $341,000 - $351,484
2
Beds
1
Bath
898
Sq Ft
$385/Sq Ft
Est. Value
About This Home
This home is located at 94 Royland Rd, Warwick, RI 02889 and is currently estimated at $346,121, approximately $385 per square foot. 94 Royland Rd is a home located in Kent County with nearby schools including Saint Kevin School and Bishop Hendricken High School.
Ownership History
Date
Name
Owned For
Owner Type
Purchase Details
Closed on
Aug 31, 2021
Sold by
Stanley James B
Bought by
Stanley Daniel J and Castaldi Jennifer A
Current Estimated Value
Home Financials for this Owner
Home Financials are based on the most recent Mortgage that was taken out on this home.
Original Mortgage
$176,000
Outstanding Balance
$159,199
Interest Rate
2.7%
Mortgage Type
New Conventional
Estimated Equity
$186,922
Purchase Details
Closed on
Sep 15, 2008
Sold by
Jacques Harold
Bought by
Stanley James B and Stanley Patricia I
Home Financials for this Owner
Home Financials are based on the most recent Mortgage that was taken out on this home.
Original Mortgage
$162,000
Interest Rate
6.58%
Mortgage Type
Purchase Money Mortgage
Create a Home Valuation Report for This Property
The Home Valuation Report is an in-depth analysis detailing your home's value as well as a comparison with similar homes in the area
Home Values in the Area
Average Home Value in this Area
Purchase History
| Date | Buyer | Sale Price | Title Company |
|---|---|---|---|
| Stanley Daniel J | -- | None Available | |
| Stanley James B | $165,000 | -- |
Source: Public Records
Mortgage History
| Date | Status | Borrower | Loan Amount |
|---|---|---|---|
| Open | Stanley Daniel J | $176,000 | |
| Previous Owner | Stanley James B | $148,651 | |
| Previous Owner | Stanley James B | $162,000 |
Source: Public Records
Tax History Compared to Growth
Tax History
| Year | Tax Paid | Tax Assessment Tax Assessment Total Assessment is a certain percentage of the fair market value that is determined by local assessors to be the total taxable value of land and additions on the property. | Land | Improvement |
|---|---|---|---|---|
| 2025 | $3,806 | $299,700 | $105,800 | $193,900 |
| 2024 | $3,675 | $254,000 | $92,000 | $162,000 |
| 2023 | $3,604 | $254,000 | $92,000 | $162,000 |
| 2022 | $3,504 | $187,100 | $64,300 | $122,800 |
| 2021 | $3,504 | $187,100 | $64,300 | $122,800 |
| 2020 | $3,504 | $187,100 | $64,300 | $122,800 |
| 2019 | $3,504 | $187,100 | $64,300 | $122,800 |
| 2018 | $2,920 | $140,400 | $64,300 | $76,100 |
| 2017 | $2,842 | $140,400 | $64,300 | $76,100 |
| 2016 | $2,842 | $140,400 | $64,300 | $76,100 |
| 2015 | $2,291 | $110,400 | $57,000 | $53,400 |
| 2014 | $2,215 | $110,400 | $57,000 | $53,400 |
| 2013 | $2,185 | $110,400 | $57,000 | $53,400 |
Source: Public Records
Map
Nearby Homes
- 67 Brewster Dr
- 81 Yucatan Dr
- 139 Yucatan Dr
- 176 Vernon St
- 418 Lake Shore Dr
- 32 Omaha Blvd
- 26 Dallas Ave
- 40 Cavalcade Blvd
- 144 Hoxsie Ave
- 12 Lima St
- 52 Recess Ln
- 41 Recess Ln
- 107 Glenwood Dr
- 100 Aurora Dr
- 985 Cedar Swamp Rd
- 161 W Shore Rd Unit B5
- 33 Hargraves St
- 78 Jennie Ln
- 700 Sandy Ln Unit 6
- 700 Sandy Ln Unit 17
- 100 Royland Rd
- 80 Royland Rd
- 93 Royland Rd
- 106 Royland Rd
- 101 Royland Rd
- 74 Royland Rd
- 111 Betsey Williams Dr
- 125 Betsey Williams Dr
- 79 Royland Rd
- 103 Betsey Williams Dr
- 131 Betsy Williams Dr
- 131 Betsey Williams Dr
- 94 Stanmore Rd
- 109 Royland Rd
- 112 Royland Rd
- 102 Stanmore Rd
- 97 Betsey Williams Dr
- 139 Betsy Williams Dr
- 139 Betsey Williams Dr
- 115 Royland Rd