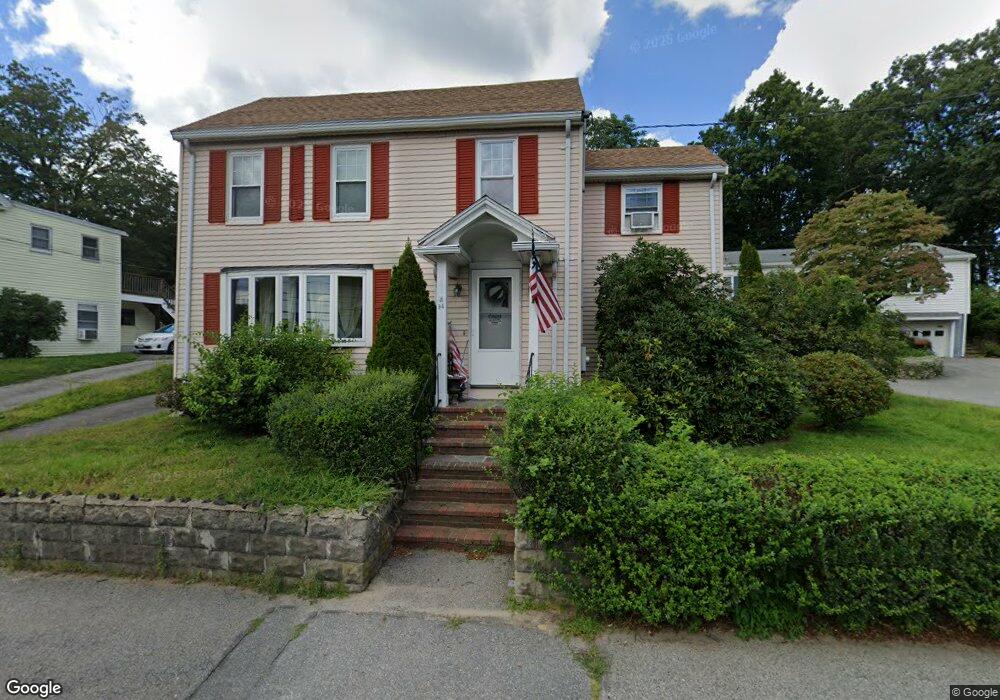
94 Salem St Unit 1 Woburn, MA 01801
Downtown Woburn NeighborhoodEstimated Value: $525,000 - $757,792
2
Beds
1
Bath
1,000
Sq Ft
$695/Sq Ft
Est. Value
About This Home
This home is located at 94 Salem St Unit 1, Woburn, MA 01801 and is currently estimated at $694,698, approximately $694 per square foot. 94 Salem St Unit 1 is a home located in Middlesex County with nearby schools including Malcolm White Elementary School, John F. Kennedy Middle School, and Woburn High School.
Ownership History
Date
Name
Owned For
Owner Type
Purchase Details
Closed on
Mar 30, 2015
Sold by
Motto Joseph and Motto Maria G
Bought by
Motto Ft and Motto
Current Estimated Value
Purchase Details
Closed on
Mar 11, 2009
Sold by
Labriola Mary L
Bought by
Motta Joseph and Motta Maria G
Purchase Details
Closed on
Sep 27, 2007
Sold by
Labriola Anthony M and Labriola Mary L
Bought by
Labriola Mary L
Create a Home Valuation Report for This Property
The Home Valuation Report is an in-depth analysis detailing your home's value as well as a comparison with similar homes in the area
Home Values in the Area
Average Home Value in this Area
Purchase History
| Date | Buyer | Sale Price | Title Company |
|---|---|---|---|
| Motto Ft | -- | -- | |
| Motto Ft | -- | -- | |
| Motta Joseph | $255,000 | -- | |
| Motta Joseph | $255,000 | -- | |
| Labriola Mary L | -- | -- | |
| Labriola Mary L | -- | -- |
Source: Public Records
Mortgage History
| Date | Status | Borrower | Loan Amount |
|---|---|---|---|
| Previous Owner | Labriola Mary L | $50,000 |
Source: Public Records
Tax History Compared to Growth
Tax History
| Year | Tax Paid | Tax Assessment Tax Assessment Total Assessment is a certain percentage of the fair market value that is determined by local assessors to be the total taxable value of land and additions on the property. | Land | Improvement |
|---|---|---|---|---|
| 2025 | $4,905 | $574,300 | $300,300 | $274,000 |
| 2024 | $4,456 | $552,900 | $286,000 | $266,900 |
| 2023 | $4,486 | $515,600 | $260,000 | $255,600 |
| 2022 | $4,237 | $453,600 | $226,100 | $227,500 |
| 2021 | $4,131 | $442,800 | $215,300 | $227,500 |
| 2020 | $3,798 | $407,500 | $215,300 | $192,200 |
| 2019 | $3,533 | $371,900 | $205,000 | $166,900 |
| 2018 | $13,248 | $349,000 | $188,100 | $160,900 |
| 2017 | $2,826 | $284,300 | $179,100 | $105,200 |
| 2016 | $2,651 | $263,800 | $167,400 | $96,400 |
| 2015 | $2,572 | $252,900 | $156,500 | $96,400 |
| 2014 | $2,561 | $245,300 | $156,500 | $88,800 |
Source: Public Records
Map
Nearby Homes
- 9 Wade Ave
- 18 Church St Unit 2
- 14 Church Ave
- 14 Church Ave Unit 2
- 74 Beach St Unit 6-12
- 74 Beach St Unit 3
- 2 Eastern Ave
- 34 Union St
- 477 Main St
- 602 Main St Unit 1
- 12 Mishawum Rd
- 11 Hovey St
- 1 Boline Place
- 21 Franklin St
- 18 Gardner Ave
- 62 Jefferson Ave
- 37 1/2 Chestnut St
- 7 Prospect St
- 462 Place Ln
- 166 Place Ln Unit 166