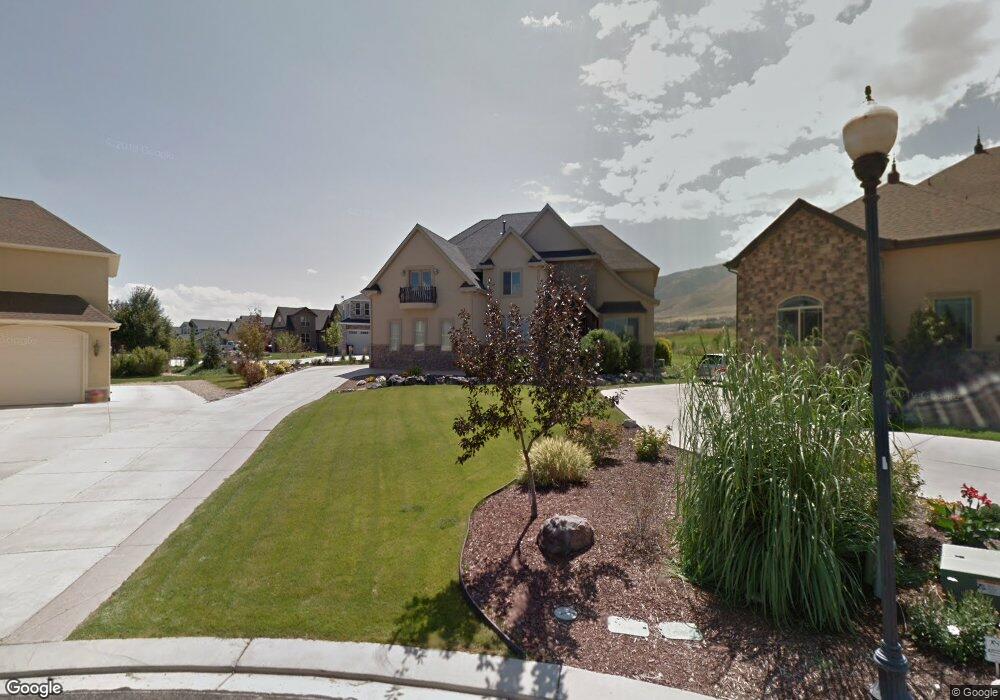
94 Seven Iron Ct Saratoga Springs, UT 84045
Estimated Value: $780,000 - $967,000
5
Beds
4
Baths
3,528
Sq Ft
$258/Sq Ft
Est. Value
About This Home
This home is located at 94 Seven Iron Ct, Saratoga Springs, UT 84045 and is currently estimated at $909,544, approximately $257 per square foot. 94 Seven Iron Ct is a home located in Utah County with nearby schools including Springside Elementary School, Lake Mountain Middle School, and Westlake High School.
Ownership History
Date
Name
Owned For
Owner Type
Purchase Details
Closed on
Aug 3, 2011
Sold by
Luker Matthew
Bought by
Vail James W
Current Estimated Value
Home Financials for this Owner
Home Financials are based on the most recent Mortgage that was taken out on this home.
Original Mortgage
$264,000
Outstanding Balance
$172,242
Interest Rate
3.37%
Mortgage Type
Adjustable Rate Mortgage/ARM
Estimated Equity
$737,302
Purchase Details
Closed on
Jul 21, 2006
Sold by
Larsen Family Investments Llc
Bought by
Luker Matthew
Home Financials for this Owner
Home Financials are based on the most recent Mortgage that was taken out on this home.
Original Mortgage
$550,000
Interest Rate
8.37%
Mortgage Type
Construction
Purchase Details
Closed on
Jul 21, 2005
Sold by
Saratoga Springs Development Llc
Bought by
Timberlake Homes Inc
Home Financials for this Owner
Home Financials are based on the most recent Mortgage that was taken out on this home.
Original Mortgage
$89,600
Interest Rate
5.46%
Mortgage Type
Purchase Money Mortgage
Create a Home Valuation Report for This Property
The Home Valuation Report is an in-depth analysis detailing your home's value as well as a comparison with similar homes in the area
Home Values in the Area
Average Home Value in this Area
Purchase History
| Date | Buyer | Sale Price | Title Company |
|---|---|---|---|
| Vail James W | -- | 1St National Title Insurance | |
| Luker Matthew | -- | First American Title Agency | |
| Timberlake Homes Inc | -- | Priority Title |
Source: Public Records
Mortgage History
| Date | Status | Borrower | Loan Amount |
|---|---|---|---|
| Open | Vail James W | $264,000 | |
| Previous Owner | Luker Matthew | $550,000 | |
| Previous Owner | Timberlake Homes Inc | $89,600 |
Source: Public Records
Tax History Compared to Growth
Tax History
| Year | Tax Paid | Tax Assessment Tax Assessment Total Assessment is a certain percentage of the fair market value that is determined by local assessors to be the total taxable value of land and additions on the property. | Land | Improvement |
|---|---|---|---|---|
| 2025 | $3,477 | $859,000 | $284,900 | $574,100 |
| 2024 | $3,477 | $417,725 | $0 | $0 |
| 2023 | $3,189 | $411,895 | $0 | $0 |
| 2022 | $3,106 | $391,215 | $0 | $0 |
| 2021 | $2,793 | $525,200 | $162,000 | $363,200 |
| 2020 | $2,675 | $493,800 | $144,600 | $349,200 |
| 2019 | $2,288 | $437,600 | $130,200 | $307,400 |
| 2018 | $2,294 | $414,000 | $119,300 | $294,700 |
| 2017 | $2,412 | $232,815 | $0 | $0 |
| 2016 | $2,247 | $201,355 | $0 | $0 |
| 2015 | $2,110 | $179,355 | $0 | $0 |
| 2014 | $1,988 | $167,090 | $0 | $0 |
Source: Public Records
Map
Nearby Homes
- 244 E Range Rd
- 1767 S Centennial Blvd
- 277 E Bennett Ln
- 1759 S Amanda Ln
- 1698 S Amanda Ln
- 231 S Wiltshire Ln
- 1602 S Wiltshire Ln
- 1582 S Wiltshire Ln
- 1907 S Centennial Blvd
- 2199 S Morgan Rd
- 2226 S Maverick Rd
- 151 E Cameron Dr
- 2237 S Maverick Rd
- 1470 S Trapper Rd
- 2274 S Browning Dr
- 2238 S Western Dr
- 2156 S Centennial Blvd Unit 1351
- 2162 S Ruger Dr
- 1608 S Terrace Rd
- 78 Watson Dr
- 94 E Seven Iron Ct
- 91 E Seven Iron Ct
- 91 Seven Iron Ct
- 1867 S Prairie Pond Rd
- 1867 S Prairie Pond Rd
- 1867 S Prairie Pond Rd Unit 1537
- 1867 S Prairie Pond Rd Unit 1537
- 1867 S Prairie Pond Rd Unit 37
- 106 Seven Iron Ct
- 106 Seven Iron Ct Unit 1552
- 106 E Seven Iron Ct
- 97 Seven Iron Ct
- 97 E Seven Iron Ct Unit 1555
- 97 E Seven Iron Ct
- 111 Par St
- 1871 S Prairie Pond Rd Unit 1536
- 1871 S Prairie Pond Rd
- 1871 S Prairie Pond Rd
- 103 E Seven Iron Ct Unit 103
- 103 E Seven Iron Ct Unit 103