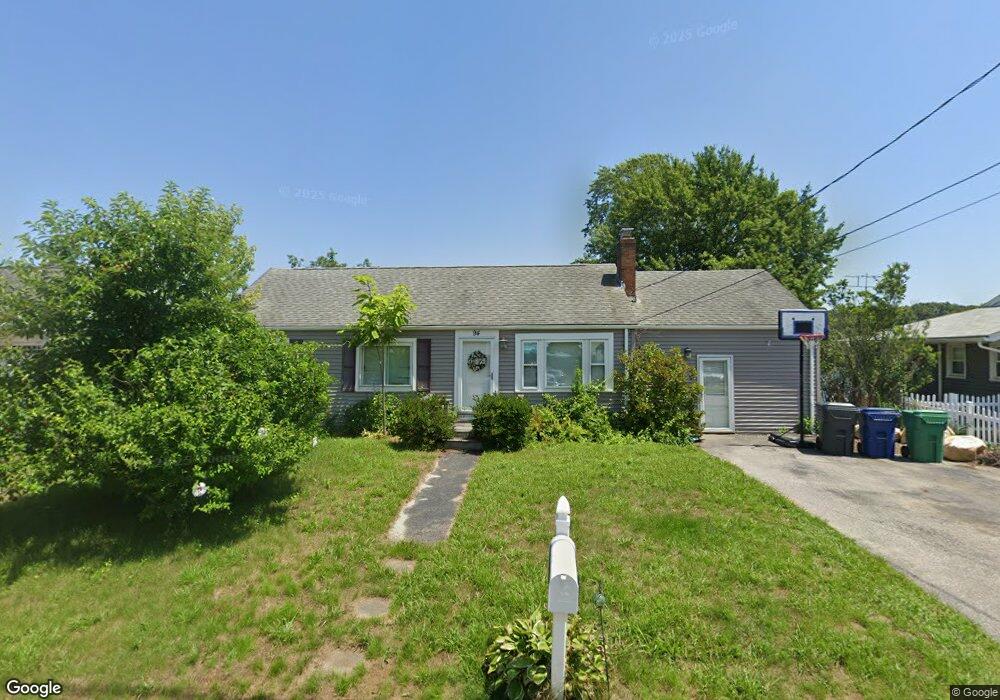
94 Trent Ave Warwick, RI 02889
Wildes Corner NeighborhoodEstimated Value: $399,000 - $446,000
3
Beds
1
Bath
1,264
Sq Ft
$332/Sq Ft
Est. Value
About This Home
This home is located at 94 Trent Ave, Warwick, RI 02889 and is currently estimated at $419,525, approximately $331 per square foot. 94 Trent Ave is a home located in Kent County with nearby schools including Saint Kevin School and Bishop Hendricken High School.
Ownership History
Date
Name
Owned For
Owner Type
Purchase Details
Closed on
Jun 26, 2024
Sold by
Warwick City Of
Bought by
Hilltop Hm Llc
Current Estimated Value
Purchase Details
Closed on
Jul 6, 2015
Sold by
Fandetti Amanda
Bought by
Little Pond Props Llc
Purchase Details
Closed on
Oct 27, 2011
Sold by
Fnma
Bought by
Fandetti Amanda
Purchase Details
Closed on
Apr 21, 2010
Sold by
Gillard Michael and Fnma
Bought by
Federal National Mortgage Association
Purchase Details
Closed on
Aug 17, 2007
Sold by
Gillard Betty A Est and Gillard
Bought by
Gillard Michael
Home Financials for this Owner
Home Financials are based on the most recent Mortgage that was taken out on this home.
Original Mortgage
$216,000
Interest Rate
6.67%
Mortgage Type
Purchase Money Mortgage
Purchase Details
Closed on
Jun 30, 1998
Sold by
Curci Diego W and Curci Assunta
Bought by
Clair Fanch N and Fancher Patricia
Create a Home Valuation Report for This Property
The Home Valuation Report is an in-depth analysis detailing your home's value as well as a comparison with similar homes in the area
Home Values in the Area
Average Home Value in this Area
Purchase History
| Date | Buyer | Sale Price | Title Company |
|---|---|---|---|
| Hilltop Hm Llc | $1,771 | None Available | |
| Hilltop Hm Llc | $1,771 | None Available | |
| Little Pond Props Llc | -- | -- | |
| Fandetti Amanda | $160,400 | -- | |
| Federal National Mortgage Association | $253,631 | -- | |
| Gillard Michael | $270,000 | -- | |
| Clair Fanch N | $37,000 | -- | |
| Little Pond Props Llc | -- | -- | |
| Fandetti Amanda | $160,400 | -- | |
| Federal National Mortgage Association | $253,631 | -- | |
| Gillard Michael | $270,000 | -- | |
| Clair Fanch N | $37,000 | -- |
Source: Public Records
Mortgage History
| Date | Status | Borrower | Loan Amount |
|---|---|---|---|
| Previous Owner | Clair Fanch N | $3,500 | |
| Previous Owner | Clair Fanch N | $216,000 |
Source: Public Records
Tax History Compared to Growth
Tax History
| Year | Tax Paid | Tax Assessment Tax Assessment Total Assessment is a certain percentage of the fair market value that is determined by local assessors to be the total taxable value of land and additions on the property. | Land | Improvement |
|---|---|---|---|---|
| 2025 | $5,347 | $421,000 | $179,200 | $241,800 |
| 2024 | $5,150 | $355,900 | $148,100 | $207,800 |
| 2023 | $5,050 | $355,900 | $148,100 | $207,800 |
| 2022 | $4,604 | $245,800 | $90,500 | $155,300 |
| 2021 | $4,604 | $245,800 | $90,500 | $155,300 |
| 2020 | $4,604 | $245,800 | $90,500 | $155,300 |
| 2019 | $4,604 | $245,800 | $90,500 | $155,300 |
| 2018 | $3,994 | $192,000 | $85,400 | $106,600 |
| 2017 | $3,886 | $192,000 | $85,400 | $106,600 |
| 2016 | $3,886 | $192,000 | $85,400 | $106,600 |
| 2015 | $3,918 | $188,800 | $98,600 | $90,200 |
| 2014 | $3,787 | $188,800 | $98,600 | $90,200 |
| 2013 | $3,736 | $188,800 | $98,600 | $90,200 |
Source: Public Records
Map
Nearby Homes
- 700 Sandy Ln Unit 6
- 700 Sandy Ln Unit 17
- 700 Sandy Ln Unit 18
- 700 Sandy Ln Unit 1
- 136 Sefton Ave
- 86 Glen Dr
- 985 Cedar Swamp Rd
- 176 Canfield Ave
- 191 Canfield Ave
- 183 Shand Ave
- 206 Reynolds Ave
- 121 Hamilton Ave
- 199 Cottage Grove Ave
- 9 Chelmsford Ave
- 70 Turner St Unit C-6
- 53 Uphill Ave
- 34 Pequot Ave
- 64 Ormsby Ave
- 139 Yucatan Dr
- 31 Oakhurst Ave