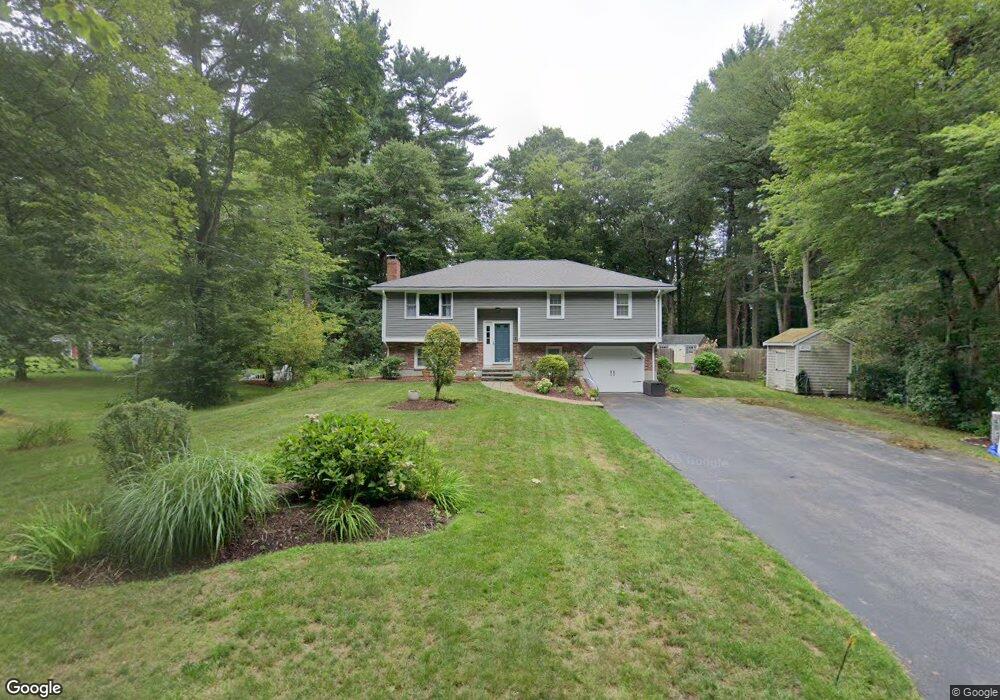
94 Tucker Rd Hanover, MA 02339
Estimated Value: $682,000 - $768,000
3
Beds
2
Baths
1,343
Sq Ft
$530/Sq Ft
Est. Value
About This Home
This home is located at 94 Tucker Rd, Hanover, MA 02339 and is currently estimated at $711,639, approximately $529 per square foot. 94 Tucker Rd is a home located in Plymouth County with nearby schools including Hanover High School, Cadence Academy Preschool - Hanover, and The Master's Academy.
Ownership History
Date
Name
Owned For
Owner Type
Purchase Details
Closed on
Jul 23, 2009
Sold by
Ahola Charles A and Ahola Brenda J
Bought by
Mccarthy Thomas R and Mccarthy Caitlin K
Current Estimated Value
Create a Home Valuation Report for This Property
The Home Valuation Report is an in-depth analysis detailing your home's value as well as a comparison with similar homes in the area
Home Values in the Area
Average Home Value in this Area
Purchase History
| Date | Buyer | Sale Price | Title Company |
|---|---|---|---|
| Mccarthy Thomas R | $371,750 | -- | |
| Mccarthy Thomas R | $371,750 | -- |
Source: Public Records
Mortgage History
| Date | Status | Borrower | Loan Amount |
|---|---|---|---|
| Open | Mccarthy Thomas R | $347,000 | |
| Closed | Mccarthy Thomas R | $352,000 |
Source: Public Records
Tax History
| Year | Tax Paid | Tax Assessment Tax Assessment Total Assessment is a certain percentage of the fair market value that is determined by local assessors to be the total taxable value of land and additions on the property. | Land | Improvement |
|---|---|---|---|---|
| 2025 | $7,776 | $629,600 | $240,400 | $389,200 |
| 2024 | $7,732 | $602,200 | $240,400 | $361,800 |
| 2023 | $7,548 | $559,500 | $218,600 | $340,900 |
| 2022 | $7,457 | $489,000 | $218,600 | $270,400 |
| 2021 | $7,273 | $445,400 | $198,700 | $246,700 |
| 2020 | $7,194 | $441,100 | $198,700 | $242,400 |
| 2019 | $6,681 | $407,100 | $198,700 | $208,400 |
| 2018 | $6,558 | $402,800 | $198,700 | $204,100 |
| 2017 | $6,036 | $365,400 | $180,100 | $185,300 |
| 2016 | $5,886 | $349,100 | $163,800 | $185,300 |
| 2015 | $5,076 | $314,300 | $163,800 | $150,500 |
Source: Public Records
Map
Nearby Homes
- 506 Main St
- 62 Larchmont Ln
- 168 Larchmont Ln
- 776 Main St
- 44 Stone Meadow Ln
- 47 Stone Meadow Ln
- 36 Grove St
- 250 Center St
- 51 Cervelli Farm Dr
- 37 Dr
- 23 Cervelli Farm Dr
- 38 Cervelli Farm Dr
- 9 Cervelli Farm Dr
- 36 Bayberry Ln
- 53 Chestnut St
- 75 School St
- 127 King St
- 95 Tecumseh Dr
- 535 Webster St
- 823 Market St
Your Personal Tour Guide
Ask me questions while you tour the home.