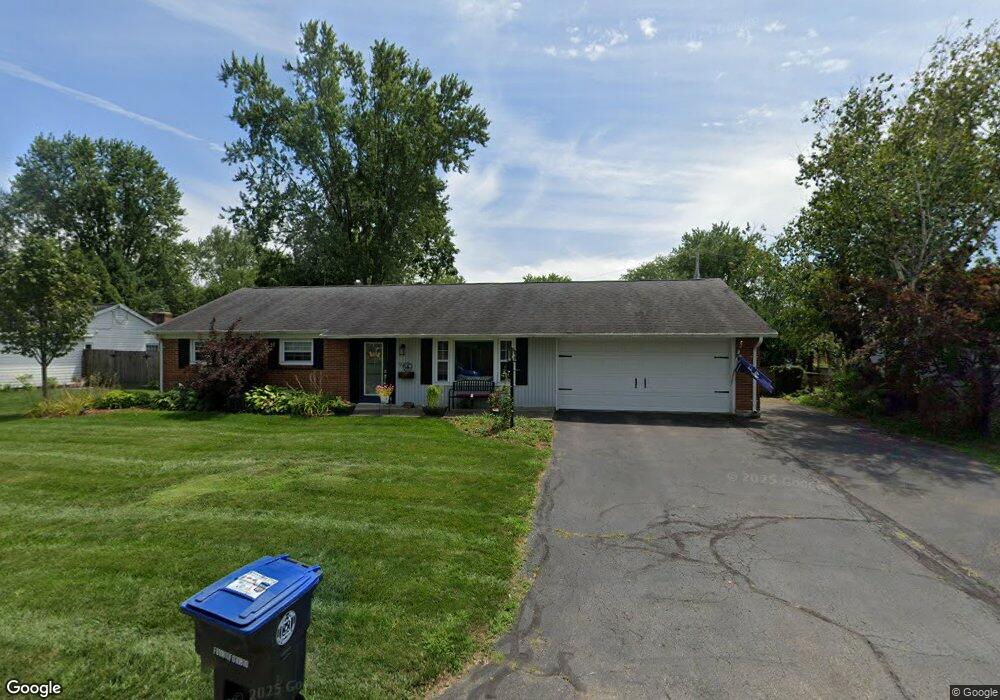
94 Tuxworth Rd Dayton, OH 45458
Estimated Value: $259,000 - $297,000
3
Beds
2
Baths
1,330
Sq Ft
$213/Sq Ft
Est. Value
About This Home
This home is located at 94 Tuxworth Rd, Dayton, OH 45458 and is currently estimated at $283,435, approximately $213 per square foot. 94 Tuxworth Rd is a home located in Montgomery County with nearby schools including Primary Village South, Cline Elementary, and Tower Heights Middle School.
Ownership History
Date
Name
Owned For
Owner Type
Purchase Details
Closed on
May 20, 2019
Sold by
Marcell Julie Zimmer and Marcell Christopher M
Bought by
Frangione Anthony and Cook Emily
Current Estimated Value
Home Financials for this Owner
Home Financials are based on the most recent Mortgage that was taken out on this home.
Original Mortgage
$148,000
Outstanding Balance
$129,858
Interest Rate
4.1%
Mortgage Type
New Conventional
Estimated Equity
$153,577
Purchase Details
Closed on
Mar 31, 2016
Sold by
Zimmer Walter P and Zimmer Julie Jean
Bought by
Zimmer Julie Jean
Purchase Details
Closed on
Dec 17, 2015
Sold by
Zimmer Leo F
Bought by
Zimmer Leo F
Home Financials for this Owner
Home Financials are based on the most recent Mortgage that was taken out on this home.
Interest Rate
3.97%
Purchase Details
Closed on
Sep 14, 1998
Sold by
Gabbard Ronald L and Gabbard Peggy L
Bought by
Zimmer Leo F and Zimmer Dolores M
Create a Home Valuation Report for This Property
The Home Valuation Report is an in-depth analysis detailing your home's value as well as a comparison with similar homes in the area
Home Values in the Area
Average Home Value in this Area
Purchase History
| Date | Buyer | Sale Price | Title Company |
|---|---|---|---|
| Frangione Anthony | $185,000 | Home Services Title Llc | |
| Zimmer Julie Jean | $104,370 | None Available | |
| Zimmer Leo F | -- | -- | |
| Zimmer Leo F | $107,400 | -- | |
| Zimmer Leo F | $107,400 | -- |
Source: Public Records
Mortgage History
| Date | Status | Borrower | Loan Amount |
|---|---|---|---|
| Open | Frangione Anthony | $148,000 | |
| Previous Owner | Zimmer Leo F | -- |
Source: Public Records
Tax History Compared to Growth
Tax History
| Year | Tax Paid | Tax Assessment Tax Assessment Total Assessment is a certain percentage of the fair market value that is determined by local assessors to be the total taxable value of land and additions on the property. | Land | Improvement |
|---|---|---|---|---|
| 2024 | $4,983 | $85,780 | $13,830 | $71,950 |
| 2023 | $4,983 | $85,780 | $13,830 | $71,950 |
| 2022 | $4,590 | $62,660 | $10,100 | $52,560 |
| 2021 | $4,603 | $62,660 | $10,100 | $52,560 |
| 2020 | $4,597 | $62,660 | $10,100 | $52,560 |
| 2019 | $3,671 | $44,610 | $10,100 | $34,510 |
| 2018 | $3,254 | $44,610 | $10,100 | $34,510 |
| 2017 | $3,217 | $44,610 | $10,100 | $34,510 |
| 2016 | $2,558 | $42,170 | $10,100 | $32,070 |
| 2015 | $2,532 | $42,170 | $10,100 | $32,070 |
| 2014 | $2,532 | $42,170 | $10,100 | $32,070 |
| 2012 | -- | $41,210 | $9,770 | $31,440 |
Source: Public Records
Map
Nearby Homes
- 170 S Main St Unit C
- 156 Mallard Glen Dr Unit 4
- 435 Clareridge Ln
- 35 Bywood Ct
- 140 Mallard Glen Dr Unit 3
- 694 Spring Ridge Place
- 92 E Ridgeway Dr
- 155 Bristol Dr
- 40 Cemetery Dr
- 325 Annette Dr
- 306 Monarch Rd
- 843 Clareridge Ln Unit 843
- 61 Lynn Rae Cir
- 121 Woodfield Place
- 284 Tauber Dr
- 311 E Franklin St
- 8977 Slagle Rd
- 553 E Spring Valley Pike
- 296 Tauber Dr
- 20 Gershwin Dr
- 104 Tuxworth Rd
- 84 Tuxworth Rd
- 115 Waterford Dr
- 105 Waterford Dr
- 114 Tuxworth Rd
- 95 Tuxworth Rd
- 74 Tuxworth Rd
- 105 Tuxworth Rd
- 85 Tuxworth Rd
- 125 Waterford Dr
- 95 Waterford Dr
- 75 Tuxworth Rd
- 115 Tuxworth Rd
- 264 Bellingham Dr
- 254 Bellingham Dr
- 64 Tuxworth Rd
- 124 Tuxworth Rd
- 124 Waterford Dr
- 104 Benzell Dr
- 284 Bellingham Dr