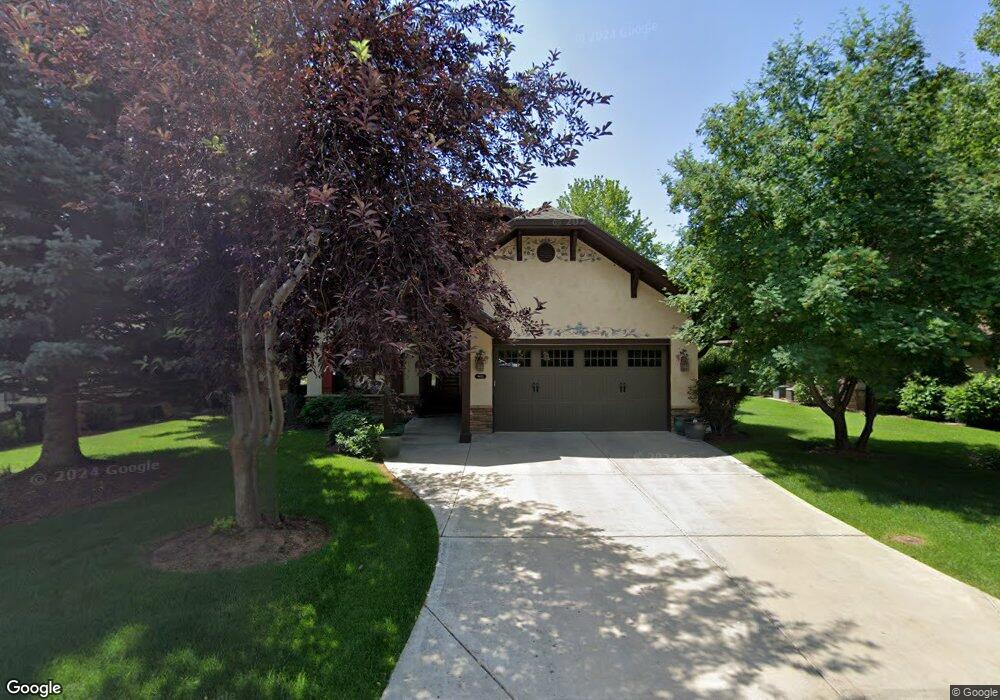
94 Valais Pkwy Midway, UT 84049
Estimated Value: $1,105,000 - $1,146,000
--
Bed
--
Bath
2,523
Sq Ft
$446/Sq Ft
Est. Value
About This Home
This home is located at 94 Valais Pkwy, Midway, UT 84049 and is currently estimated at $1,125,396, approximately $446 per square foot. 94 Valais Pkwy is a home located in Wasatch County with nearby schools including Midway Elementary School, Rocky Mountain Middle School, and Wasatch High School.
Ownership History
Date
Name
Owned For
Owner Type
Purchase Details
Closed on
Feb 3, 2021
Sold by
Gillett Richard L
Bought by
Richard L Gillett Trust and Sharon L Gillet Trust
Current Estimated Value
Purchase Details
Closed on
Jan 29, 2021
Sold by
Gillett Richard F and Anderson Julie
Bought by
Tezak Jennifer F
Purchase Details
Closed on
Sep 27, 2013
Sold by
Newland Kay C
Bought by
Gillett Richard L and Gillett Sharon L
Purchase Details
Closed on
Apr 3, 2009
Sold by
Newland Wayne L
Bought by
Newland Wayne L and Newland Kay C
Home Financials for this Owner
Home Financials are based on the most recent Mortgage that was taken out on this home.
Original Mortgage
$383,000
Interest Rate
5.06%
Mortgage Type
New Conventional
Create a Home Valuation Report for This Property
The Home Valuation Report is an in-depth analysis detailing your home's value as well as a comparison with similar homes in the area
Home Values in the Area
Average Home Value in this Area
Purchase History
| Date | Buyer | Sale Price | Title Company |
|---|---|---|---|
| Richard L Gillett Trust | -- | -- | |
| Tezak Jennifer F | -- | Metro Title And Escrow | |
| Gillett Richard L | -- | Atla Title Insurance | |
| Gillett Richard L | -- | Atlas Title Insurance | |
| Newland Wayne L | -- | Atlas Title Insurance | |
| Newland Wayne L | -- | Atlas Title Insurance |
Source: Public Records
Mortgage History
| Date | Status | Borrower | Loan Amount |
|---|---|---|---|
| Previous Owner | Newland Wayne L | $383,000 |
Source: Public Records
Tax History Compared to Growth
Tax History
| Year | Tax Paid | Tax Assessment Tax Assessment Total Assessment is a certain percentage of the fair market value that is determined by local assessors to be the total taxable value of land and additions on the property. | Land | Improvement |
|---|---|---|---|---|
| 2025 | $4,412 | $870,435 | $275,000 | $595,435 |
| 2024 | $6,110 | $1,082,367 | $275,000 | $807,367 |
| 2023 | $6,110 | $905,980 | $250,000 | $655,980 |
| 2022 | $4,996 | $905,980 | $250,000 | $655,980 |
| 2021 | $9,258 | $713,561 | $141,750 | $571,811 |
| 2020 | $5,251 | $713,561 | $141,750 | $571,811 |
| 2019 | $4,803 | $392,459 | $0 | $0 |
| 2018 | $4,485 | $366,491 | $0 | $0 |
| 2017 | $4,055 | $329,322 | $0 | $0 |
| 2016 | $3,914 | $310,072 | $0 | $0 |
| 2015 | $3,719 | $310,072 | $0 | $0 |
| 2014 | $3,202 | $310,072 | $0 | $0 |
Source: Public Records
Map
Nearby Homes
- 1336 Antibe Ln
- 1336 N Antibe Ln
- 57 W Oberland Ct
- 92 W Village Ct
- 1182 N Canyon View Rd Unit 11
- 1182 N Canyon View Rd
- 1070 Interlaken Dr
- 1097 Matterhorn Ct
- 1625 N Cambridge Dr Unit 10
- 1636 N Cambridge Dr Unit 13
- 1633 N Cambridge Dr Unit 11
- 1615 N Cambridge Dr Unit 9
- 35 W Burgi Ln
- 1128 N Springer View Loop
- 1126 Springer View Loop
- 253 St Moritz Rd
- 752 N Wellness Dr Unit 25
- 245 W Big Matterhorn Cir
- 363 W 1150 N
- 95 Matterhorn Cir Unit 95
- 94 E Valais Pkwy
- 100 E Valais Pkwy
- 86 E Valais Pkwy
- 84 E Valais Pkwy
- 114 Valais Pkwy
- 100 Valais Pkwy
- 78 E Valais Pkwy
- 120 Chatelle Cove
- 130 E Valais Pkwy
- 130 Valais Pkwy
- 110 Versailles Way
- 70 E Valais Pkwy
- 88 Versailles Way
- 128 E Chatelle Cove
- 128 Chatelle Cove
- 120 Versailles Way
- 76 Versailles Way
- 140 Valais Pkwy
- 136 Chatelle Cove
- 156 E Valais Pkwy