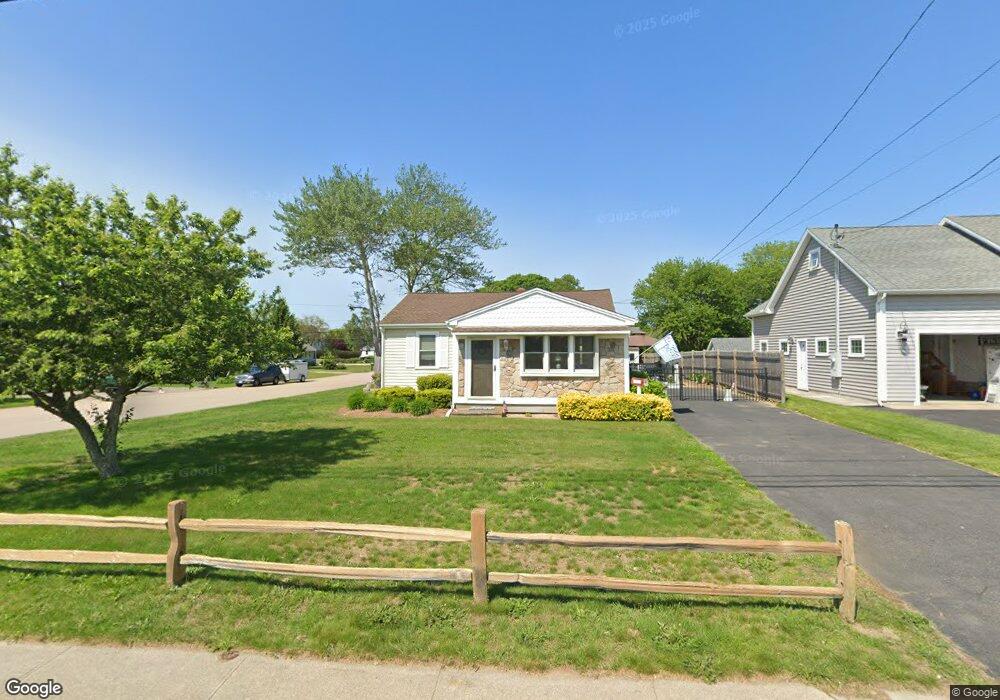
94 Weekapaug Rd Westerly, RI 02891
Estimated Value: $534,775 - $1,477,000
2
Beds
1
Bath
991
Sq Ft
$829/Sq Ft
Est. Value
About This Home
This home is located at 94 Weekapaug Rd, Westerly, RI 02891 and is currently estimated at $821,694, approximately $829 per square foot. 94 Weekapaug Rd is a home located in Washington County with nearby schools including Westerly High School.
Ownership History
Date
Name
Owned For
Owner Type
Purchase Details
Closed on
Dec 2, 1999
Sold by
Weekapaug Assoc Lp
Bought by
Mesite Donald J and Mesite Tammy S
Current Estimated Value
Home Financials for this Owner
Home Financials are based on the most recent Mortgage that was taken out on this home.
Original Mortgage
$100,000
Interest Rate
7.86%
Mortgage Type
Purchase Money Mortgage
Purchase Details
Closed on
Mar 2, 1995
Sold by
Collins Anne L
Bought by
Collins Chris L
Create a Home Valuation Report for This Property
The Home Valuation Report is an in-depth analysis detailing your home's value as well as a comparison with similar homes in the area
Home Values in the Area
Average Home Value in this Area
Purchase History
| Date | Buyer | Sale Price | Title Company |
|---|---|---|---|
| Mesite Donald J | $155,000 | -- | |
| Collins Chris L | $26,000 | -- |
Source: Public Records
Mortgage History
| Date | Status | Borrower | Loan Amount |
|---|---|---|---|
| Open | Collins Chris L | $103,800 | |
| Closed | Collins Chris L | $100,000 | |
| Previous Owner | Collins Chris L | $70,000 | |
| Previous Owner | Collins Chris L | $55,000 |
Source: Public Records
Tax History
| Year | Tax Paid | Tax Assessment Tax Assessment Total Assessment is a certain percentage of the fair market value that is determined by local assessors to be the total taxable value of land and additions on the property. | Land | Improvement |
|---|---|---|---|---|
| 2025 | $3,170 | $445,900 | $232,400 | $213,500 |
| 2024 | $3,386 | $345,200 | $166,100 | $179,100 |
| 2023 | $3,321 | $345,200 | $166,100 | $179,100 |
| 2022 | $3,300 | $345,200 | $166,100 | $179,100 |
| 2021 | $3,161 | $274,400 | $144,600 | $129,800 |
| 2020 | $3,103 | $274,400 | $144,600 | $129,800 |
| 2019 | $2,993 | $267,200 | $144,600 | $122,600 |
| 2018 | $2,820 | $237,400 | $133,400 | $104,000 |
| 2017 | $2,751 | $237,400 | $133,400 | $104,000 |
| 2016 | $2,773 | $237,400 | $133,400 | $104,000 |
| 2015 | $2,852 | $263,600 | $147,500 | $116,100 |
| 2014 | $2,805 | $263,600 | $147,500 | $116,100 |
Source: Public Records
Map
Nearby Homes
- 30 Clifford Dr
- 26 Charlene Ave
- 20 Snowberry Ln
- 22 Breach Dr
- 13 Plateau Rd
- 43 Noyes Neck Rd
- 470 Atlantic Ave
- 446 Atlantic Ave
- 5 Robin Hollow Ln
- 432 Atlantic Ave
- 54 Sherwood Dr
- 35 Robin Hollow Ln
- 342 Post Rd
- 19 Wicklow Rd
- 346 Post Rd
- 6 Verdi Rd
- 9 Compass Way Unit 201
- 9 Compass Way Unit 202
- 9 Compass Way Unit 101
- 9 Compass Way Unit 102
Your Personal Tour Guide
Ask me questions while you tour the home.