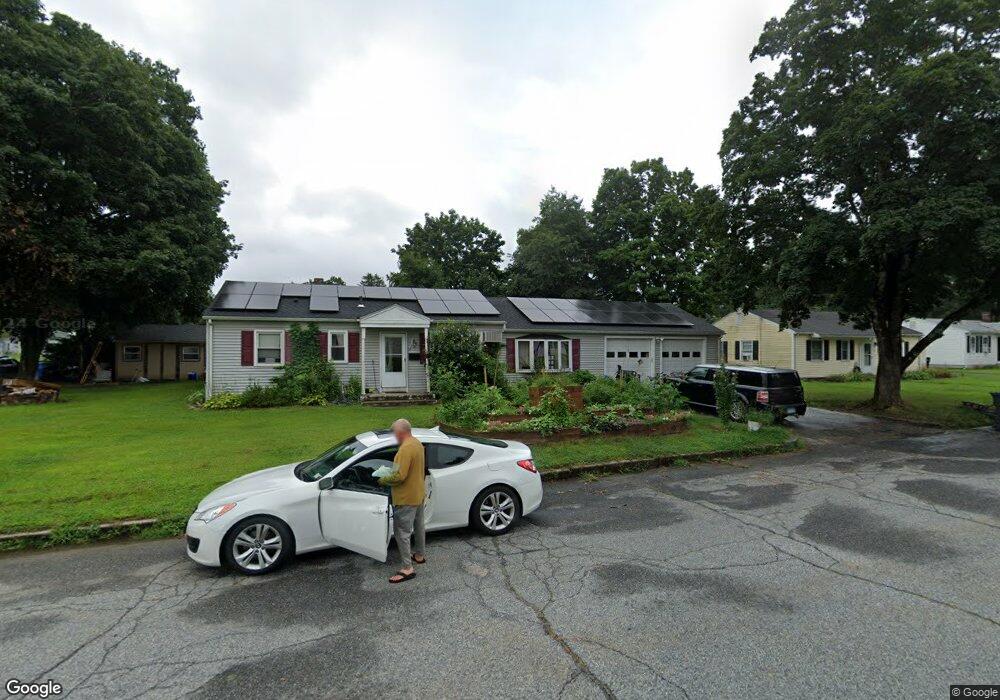
94 Woodward St Danielson, CT 06239
Estimated Value: $273,000 - $303,691
3
Beds
1
Bath
1,152
Sq Ft
$251/Sq Ft
Est. Value
About This Home
This home is located at 94 Woodward St, Danielson, CT 06239 and is currently estimated at $289,423, approximately $251 per square foot. 94 Woodward St is a home located in Windham County with nearby schools including Killingly Central School, Killingly Memorial School, and Killingly Intermediate School.
Ownership History
Date
Name
Owned For
Owner Type
Purchase Details
Closed on
Apr 7, 2009
Sold by
Albro Matthew C and Albro Annie
Bought by
Fava Timothy
Current Estimated Value
Home Financials for this Owner
Home Financials are based on the most recent Mortgage that was taken out on this home.
Original Mortgage
$117,300
Outstanding Balance
$74,073
Interest Rate
4.92%
Estimated Equity
$215,350
Purchase Details
Closed on
Mar 30, 1999
Sold by
Soler John E and Soler Barbie J
Bought by
Albro Matthew C
Purchase Details
Closed on
May 20, 1994
Sold by
Spencer Elaine
Bought by
Soler John E and Maynard Barbie J
Create a Home Valuation Report for This Property
The Home Valuation Report is an in-depth analysis detailing your home's value as well as a comparison with similar homes in the area
Home Values in the Area
Average Home Value in this Area
Purchase History
| Date | Buyer | Sale Price | Title Company |
|---|---|---|---|
| Fava Timothy | $115,000 | -- | |
| Fava Timothy | $115,000 | -- | |
| Albro Matthew C | $90,000 | -- | |
| Albro Matthew C | $90,000 | -- | |
| Soler John E | $81,500 | -- | |
| Soler John E | $81,500 | -- |
Source: Public Records
Mortgage History
| Date | Status | Borrower | Loan Amount |
|---|---|---|---|
| Open | Soler John E | $117,300 | |
| Closed | Soler John E | $117,300 | |
| Previous Owner | Soler John E | $166,600 |
Source: Public Records
Tax History Compared to Growth
Tax History
| Year | Tax Paid | Tax Assessment Tax Assessment Total Assessment is a certain percentage of the fair market value that is determined by local assessors to be the total taxable value of land and additions on the property. | Land | Improvement |
|---|---|---|---|---|
| 2025 | $3,502 | $149,320 | $28,750 | $120,570 |
| 2024 | $3,295 | $149,320 | $28,750 | $120,570 |
| 2023 | $3,066 | $107,030 | $23,730 | $83,300 |
| 2022 | $2,880 | $107,030 | $23,730 | $83,300 |
| 2021 | $2,880 | $107,030 | $23,730 | $83,300 |
| 2020 | $2,819 | $107,030 | $23,730 | $83,300 |
| 2019 | $2,875 | $107,030 | $23,730 | $83,300 |
| 2017 | $2,535 | $86,800 | $15,120 | $71,680 |
| 2016 | $2,527 | $86,800 | $15,120 | $71,680 |
| 2015 | $2,544 | $86,800 | $15,120 | $71,680 |
| 2014 | $2,475 | $86,800 | $15,120 | $71,680 |
Source: Public Records
Map
Nearby Homes
- 140 Woodward St
- 860 N Main St
- 17 Hillside Terrace
- 65 Stone St
- 16 James St
- 48 Athol St Unit 48
- 69 Peckham Ln
- 58 Athol St Unit 58
- 78 Athol St
- 409 Main St
- 415 Maple St
- 94 Mechanic St
- 144 Prospect Ave
- 10 Conrad's Park
- 61 Deerwood Dr
- 1032 N Main St Unit 9
- 14 Valley View Dr
- 18 Valley View Dr
- 16 Valley View Dr
- 24 Center St
- 1035 Davis Ave
- 86 Woodward St
- 227 Wheatley St
- 91 Woodward St
- 219 Wheatley St
- 80 Woodward St
- 1044 Davis Ave
- 1036 Davis Ave
- 85 Woodward St
- 213 Wheatley St
- 1056 Davis Ave
- 81 Woodward St
- 1063 Davis Ave
- 46 Judd Ave
- 1028 Davis Ave
- 228 Wheatley St
- 205 Wheatley St
- 54 Judd Ave
- 120 Woodward St
- 113 Woodward St