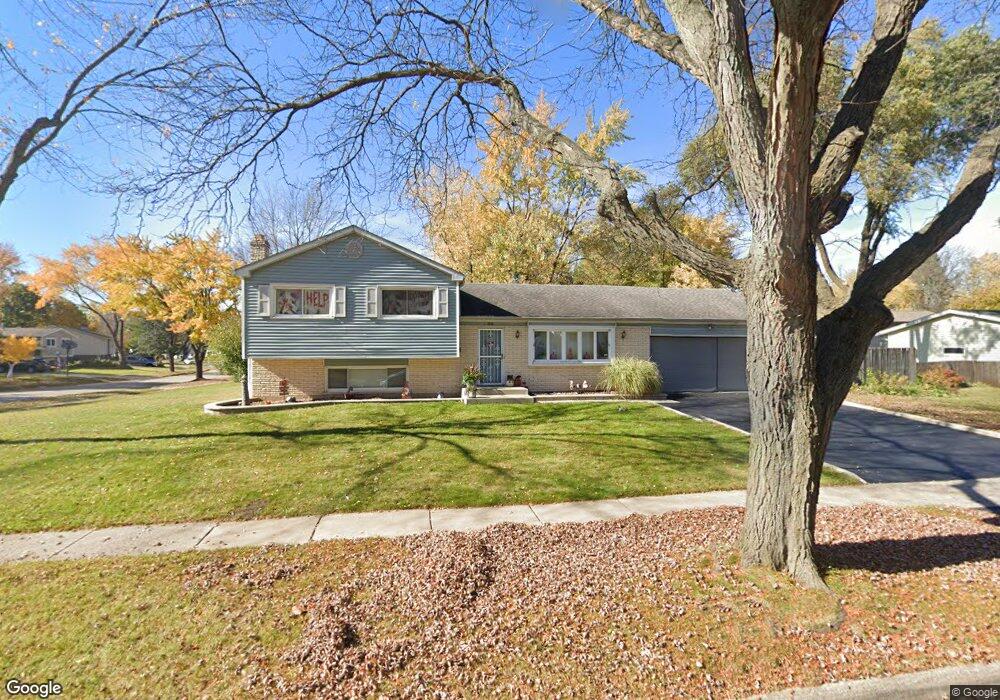
940 Darlington Ln Crystal Lake, IL 60014
Estimated Value: $289,000 - $338,332
4
Beds
2
Baths
1,150
Sq Ft
$280/Sq Ft
Est. Value
About This Home
This home is located at 940 Darlington Ln, Crystal Lake, IL 60014 and is currently estimated at $321,833, approximately $279 per square foot. 940 Darlington Ln is a home located in McHenry County with nearby schools including Coventry Elementary School, Hannah Beardsley Middle School, and Crystal Lake South High School.
Ownership History
Date
Name
Owned For
Owner Type
Purchase Details
Closed on
Aug 22, 2011
Sold by
Federal National Mortgage Association
Bought by
Foster Willard D
Current Estimated Value
Home Financials for this Owner
Home Financials are based on the most recent Mortgage that was taken out on this home.
Original Mortgage
$126,704
Outstanding Balance
$86,408
Interest Rate
4.25%
Mortgage Type
FHA
Estimated Equity
$235,425
Purchase Details
Closed on
Feb 4, 2011
Sold by
Diaz Rafael
Bought by
Federal National Mortgage Association
Purchase Details
Closed on
Apr 15, 1995
Sold by
Diaz Rafael and Diaz Josefa
Bought by
Diaz Rafael and Diaz Josefa
Purchase Details
Closed on
Jan 28, 1994
Sold by
Hartwell Kevin R and Hartwell Julie A
Bought by
Diaz Rafael and Diaz Josefa
Home Financials for this Owner
Home Financials are based on the most recent Mortgage that was taken out on this home.
Original Mortgage
$136,990
Interest Rate
7.05%
Mortgage Type
FHA
Create a Home Valuation Report for This Property
The Home Valuation Report is an in-depth analysis detailing your home's value as well as a comparison with similar homes in the area
Home Values in the Area
Average Home Value in this Area
Purchase History
| Date | Buyer | Sale Price | Title Company |
|---|---|---|---|
| Foster Willard D | $130,000 | Attorneys Title Guaranty Fun | |
| Federal National Mortgage Association | -- | None Available | |
| Diaz Rafael | -- | -- | |
| Diaz Rafael | $138,500 | Attorneys National Title |
Source: Public Records
Mortgage History
| Date | Status | Borrower | Loan Amount |
|---|---|---|---|
| Open | Foster Willard D | $126,704 | |
| Previous Owner | Diaz Rafael | $136,990 |
Source: Public Records
Tax History Compared to Growth
Tax History
| Year | Tax Paid | Tax Assessment Tax Assessment Total Assessment is a certain percentage of the fair market value that is determined by local assessors to be the total taxable value of land and additions on the property. | Land | Improvement |
|---|---|---|---|---|
| 2024 | $7,748 | $99,516 | $18,638 | $80,878 |
| 2023 | $7,459 | $89,004 | $16,669 | $72,335 |
| 2022 | $6,482 | $74,434 | $23,982 | $50,452 |
| 2021 | $6,118 | $69,344 | $22,342 | $47,002 |
| 2020 | $5,957 | $66,889 | $21,551 | $45,338 |
| 2019 | $5,792 | $64,021 | $20,627 | $43,394 |
| 2018 | $5,183 | $56,896 | $17,031 | $39,865 |
| 2017 | $5,138 | $53,599 | $16,044 | $37,555 |
| 2016 | $4,993 | $50,271 | $15,048 | $35,223 |
| 2013 | -- | $52,333 | $14,038 | $38,295 |
Source: Public Records
Map
Nearby Homes
- 160 Surrey Ln
- 860 Darlington Ln
- 1013 Nottingham Ln
- 896 Canterbury Dr
- 901 Aberdeen Dr
- 699 Darlington Ln
- 584 Somerset Ln Unit 5
- 698 Sussex Ln
- 542 Silver Aspen Cir
- 518 Silver Aspen Cir
- 600 Sussex Ln
- Chelsea Plan at Waterside at Three Oaks
- Chatham Plan at Waterside at Three Oaks
- Amherst Plan at Waterside at Three Oaks
- 567 Cress Creek Ln
- 511 Coventry Ln Unit 3
- 645 Kendallwood Ct
- 501 Coventry Ln Unit 18
- 894 N Brentwood Dr
- 740 Saint Andrews Ln Unit 22
- 932 Sheffield Dr
- 930 Darlington Ln
- 928 Darlington Ln
- 934 Sheffield Dr
- 939 Darlington Ln
- 945 Darlington Ln
- 931 Sheffield Dr
- 931 Darlington Ln
- 955 Darlington Ln
- 924 Darlington Ln
- 936 Sheffield Dr
- 935 Sheffield Dr
- 925 Darlington Ln
- 964 Darlington Ln
- 961 Darlington Ln
- 952 Abbington Dr
- 946 Abbington Dr
- 960 Abbington Dr
- 937 Sheffield Dr
- 965 Darlington Ln