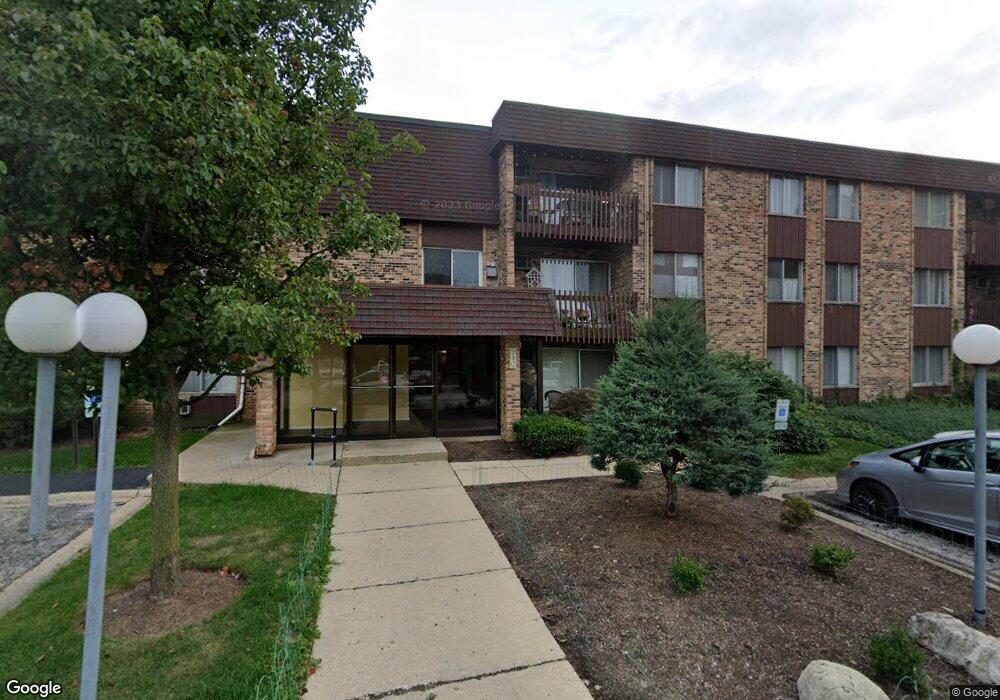
940 E Old Willow Rd Unit 94021 Prospect Heights, IL 60070
Forest River NeighborhoodEstimated Value: $149,420 - $162,000
1
Bed
--
Bath
875
Sq Ft
$176/Sq Ft
Est. Value
About This Home
This home is located at 940 E Old Willow Rd Unit 94021, Prospect Heights, IL 60070 and is currently estimated at $153,855, approximately $175 per square foot. 940 E Old Willow Rd Unit 94021 is a home located in Cook County with nearby schools including Frost Elementary School, Oliver W Holmes Middle School, and Wheeling High School.
Ownership History
Date
Name
Owned For
Owner Type
Purchase Details
Closed on
Jan 20, 2012
Sold by
Kaczmarowski Piotr and Kaczmarczyk Dominika
Bought by
Kaczmarowski Piotr and Kaczmarczyk Dominika
Current Estimated Value
Purchase Details
Closed on
Nov 18, 2011
Sold by
Deutsche Bank National Trust Company
Bought by
Kaozmarczyk Piotr and Kaozmarczyk Dominika
Purchase Details
Closed on
May 16, 2011
Sold by
Vickas Joanne and Case #10 Ch 22800
Bought by
Deutsche Bank National Trust Company
Purchase Details
Closed on
Aug 27, 1996
Sold by
Pennino Vincent R and Pennino Cecilia J
Bought by
Vickas Joanne
Home Financials for this Owner
Home Financials are based on the most recent Mortgage that was taken out on this home.
Original Mortgage
$42,700
Interest Rate
10.95%
Create a Home Valuation Report for This Property
The Home Valuation Report is an in-depth analysis detailing your home's value as well as a comparison with similar homes in the area
Home Values in the Area
Average Home Value in this Area
Purchase History
We collect this data history from publicly available records. To have your information removed, we recommend requesting removal directly through your county’s website.
| Date | Buyer | Sale Price | Title Company |
|---|---|---|---|
| Kaczmarowski Piotr | -- | None Available | |
| Kaozmarczyk Piotr | $33,000 | None Available | |
| Deutsche Bank National Trust Company | -- | None Available | |
| Vickas Joanne | $61,000 | Land Title Group Inc |
Source: Public Records
Mortgage History
We collect this data history from publicly available records. To have your information removed, we recommend requesting removal directly through your county’s website.
| Date | Status | Borrower | Loan Amount |
|---|---|---|---|
| Previous Owner | Vickas Joanne | $42,700 |
Source: Public Records
Tax History
| Year | Tax Paid | Tax Assessment Tax Assessment Total Assessment is a certain percentage of the fair market value that is determined by local assessors to be the total taxable value of land and additions on the property. | Land | Improvement |
|---|---|---|---|---|
| 2025 | $3,180 | $13,789 | $1,885 | $11,904 |
| 2024 | $3,180 | $9,203 | $754 | $8,449 |
| 2023 | $2,985 | $9,203 | $754 | $8,449 |
| 2022 | $2,985 | $9,203 | $754 | $8,449 |
| 2021 | $2,132 | $5,651 | $235 | $5,416 |
| 2020 | $2,066 | $5,651 | $235 | $5,416 |
| 2019 | $2,114 | $6,325 | $235 | $6,090 |
| 2018 | $1,857 | $4,985 | $188 | $4,797 |
| 2017 | $1,823 | $4,985 | $188 | $4,797 |
| 2016 | $1,769 | $4,985 | $188 | $4,797 |
| 2015 | $1,660 | $4,318 | $376 | $3,942 |
| 2014 | $1,621 | $4,318 | $376 | $3,942 |
| 2013 | $1,513 | $4,318 | $376 | $3,942 |
Source: Public Records
Map
Nearby Homes
- 940 E Old Willow Rd Unit 307
- 922 E Old Willow Rd Unit 208
- 920 E Old Willow Rd Unit 202
- 983 Crimson Ct Unit 2206
- 860 E Old Willow Rd Unit 221
- 870 Winesap Ct Unit 301
- 828 E Old Willow Rd Unit 216
- 826 E Old Willow Rd Unit 206
- 834 E Old Willow Rd Unit 209
- 800 E Old Willow Rd Unit 208
- 1717 N Burning Bush Ln
- 728 E Old Willow Rd Unit 104B
- 512 Piper Ln
- 1556 Quaker Ln Unit 174B
- 618 E Old Willow Rd Unit 183B
- 1240 Cove Dr Unit 221D
- 1220 Cove Dr Unit 224D
- 16 E Old Willow Rd Unit 202S
- 18 E Old Willow Rd Unit 504N
- 1413 N Burning Bush Ln
- 940 E Old Willow Rd Unit 94010
- 940 E Old Willow Rd Unit 94020
- 940 E Old Willow Rd Unit 94010
- 940 E Old Willow Rd Unit 94010
- 940 E Old Willow Rd Unit 94030
- 940 E Old Willow Rd Unit 94030
- 940 E Old Willow Rd Unit 94010
- 940 E Old Willow Rd Unit 94020
- 940 E Old Willow Rd Unit 94031
- 940 E Old Willow Rd Unit 94020
- 940 E Old Willow Rd Unit 94011
- 940 E Old Willow Rd Unit 94010
- 940 E Old Willow Rd Unit 94020
- 940 E Old Willow Rd Unit 94030
- 940 E Old Willow Rd Unit 94010
- 940 E Old Willow Rd Unit 94020
- 940 E Old Willow Rd Unit 94031
- 940 E Old Willow Rd Unit 94030
- 940 E Old Willow Rd Unit 94031
- 940 E Old Willow Rd Unit 94030
Your Personal Tour Guide
Ask me questions while you tour the home.