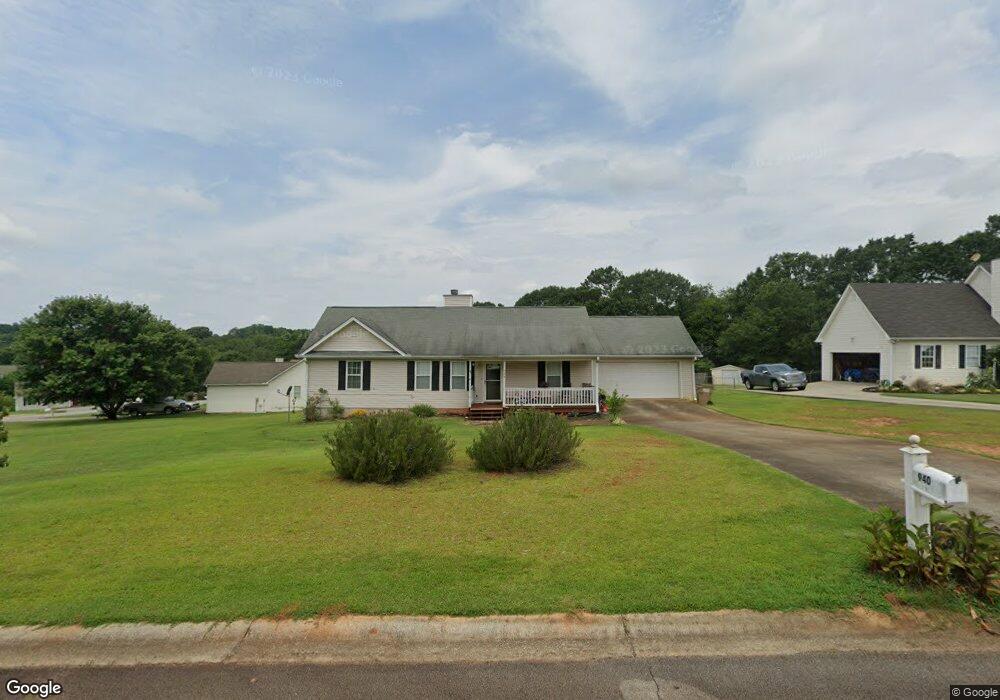
940 Justin Dr Unit 3 Winder, GA 30680
Estimated Value: $310,000 - $341,000
--
Bed
2
Baths
1,402
Sq Ft
$229/Sq Ft
Est. Value
About This Home
This home is located at 940 Justin Dr Unit 3, Winder, GA 30680 and is currently estimated at $320,828, approximately $228 per square foot. 940 Justin Dr Unit 3 is a home located in Barrow County with nearby schools including Holsenbeck Elementary School, Bear Creek Middle School, and Winder-Barrow High School.
Ownership History
Date
Name
Owned For
Owner Type
Purchase Details
Closed on
Nov 26, 2003
Sold by
Wilson Jerry D
Bought by
Boyd Brenda D
Current Estimated Value
Home Financials for this Owner
Home Financials are based on the most recent Mortgage that was taken out on this home.
Original Mortgage
$107,777
Outstanding Balance
$50,256
Interest Rate
5.97%
Mortgage Type
FHA
Estimated Equity
$270,572
Purchase Details
Closed on
Mar 13, 2001
Sold by
Patterson Dennis
Bought by
Wilson Jerry
Home Financials for this Owner
Home Financials are based on the most recent Mortgage that was taken out on this home.
Original Mortgage
$81,520
Interest Rate
7.02%
Mortgage Type
New Conventional
Purchase Details
Closed on
Mar 13, 2000
Sold by
Patterson Phillip R and Patterson Brenda E
Bought by
New Castle Construction
Home Financials for this Owner
Home Financials are based on the most recent Mortgage that was taken out on this home.
Original Mortgage
$81,000
Interest Rate
8.3%
Mortgage Type
New Conventional
Purchase Details
Closed on
May 22, 1980
Bought by
Patterson Ray and Patterson Bren
Create a Home Valuation Report for This Property
The Home Valuation Report is an in-depth analysis detailing your home's value as well as a comparison with similar homes in the area
Home Values in the Area
Average Home Value in this Area
Purchase History
| Date | Buyer | Sale Price | Title Company |
|---|---|---|---|
| Boyd Brenda D | $110,500 | -- | |
| Wilson Jerry | $101,900 | -- | |
| New Castle Construction | $18,000 | -- | |
| Patterson Ray | -- | -- |
Source: Public Records
Mortgage History
| Date | Status | Borrower | Loan Amount |
|---|---|---|---|
| Open | Boyd Brenda D | $107,777 | |
| Previous Owner | Wilson Jerry | $81,520 | |
| Previous Owner | New Castle Construction | $81,000 |
Source: Public Records
Tax History Compared to Growth
Tax History
| Year | Tax Paid | Tax Assessment Tax Assessment Total Assessment is a certain percentage of the fair market value that is determined by local assessors to be the total taxable value of land and additions on the property. | Land | Improvement |
|---|---|---|---|---|
| 2024 | $2,436 | $99,688 | $24,000 | $75,688 |
| 2023 | $1,579 | $81,474 | $18,000 | $63,474 |
| 2022 | $1,702 | $60,549 | $16,000 | $44,549 |
| 2021 | $1,789 | $60,549 | $16,000 | $44,549 |
| 2020 | $1,790 | $60,549 | $16,000 | $44,549 |
| 2019 | $1,820 | $60,549 | $16,000 | $44,549 |
| 2018 | $1,616 | $54,630 | $12,000 | $42,630 |
| 2017 | $1,234 | $42,397 | $12,000 | $30,397 |
| 2016 | $1,222 | $42,746 | $12,000 | $30,746 |
| 2015 | $1,238 | $43,094 | $12,000 | $31,094 |
| 2014 | $1,059 | $36,974 | $5,880 | $31,094 |
| 2013 | -- | $35,474 | $5,880 | $29,594 |
Source: Public Records
Map
Nearby Homes
- 1014 Brynn Dr
- 504 Stoney Creek Dr
- 1228 Highway 211 NE
- 1228 Georgia Highway 211
- 388 Kay Dr Unit 1
- 419 Pleasant Hill Church Rd NE
- 1553 Shoal Creek Dr
- 1212 Highway 211 NE
- 1226 Highway 211 NE
- 508 Pleasant Hill Church Rd NE
- 380 Glenn Trail
- 206 Ballast Trail
- 330 Anchors Way
- 130 (Tract 1) Bowman Mill Rd NE
- 0 Hancock Bridge Rd Unit 10535063
- 883 Windward Rd
- 130 Bowman Mill Rd NE Unit 1
- 63 Delightful Way Unit 1
- 23 Pierce Trail
- 385 Finch Landing Rd
- 1203 Corky Brooke Ln
- 1203 Corkybrooke Ln
- 942 Justin Dr Unit 3
- 1205 Corky Brooke Ln
- 1205 Corkybrooke Ln
- 936 Justin Dr Unit 3
- 939 Justin Dr Unit 3
- 941 Justin Dr Unit 3
- 937 Justin Dr
- 0 Cooks Rd Unit 2800824
- 0 Cooks Rd Unit 3223118
- 0 Cooks Rd Unit 8731980
- 1204 Corkybrooke Ln Unit 3
- 944 Justin Dr
- 1207 Corkybrooke Ln Unit 3
- 1006 Cooks Rd
- 943 Justin Dr
- 935 Justin Dr Unit 3
- 1206 Corky Brooke Ln
- 934 Justin Dr