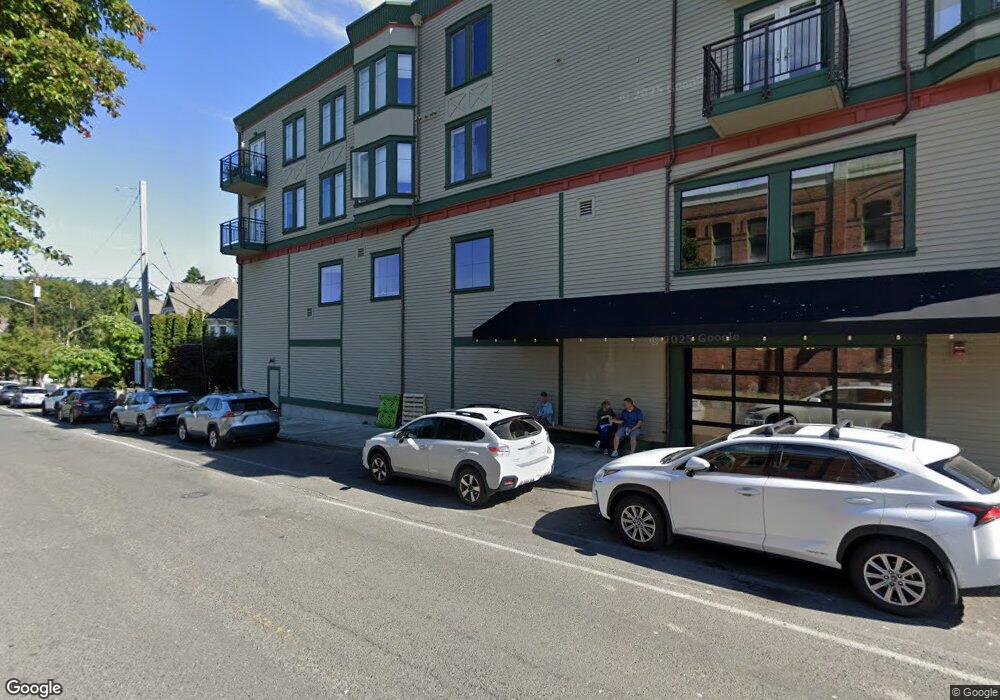
940 Lawrence St Port Townsend, WA 98368
Estimated Value: $633,607 - $916,000
2
Beds
2
Baths
1,256
Sq Ft
$576/Sq Ft
Est. Value
About This Home
This home is located at 940 Lawrence St, Port Townsend, WA 98368 and is currently estimated at $722,902, approximately $575 per square foot. 940 Lawrence St is a home located in Jefferson County with nearby schools including Salish Coast Elementary School, Blue Heron Middle School, and Port Townsend High School.
Ownership History
Date
Name
Owned For
Owner Type
Purchase Details
Closed on
Dec 26, 2013
Sold by
First Federal Savings & Loan Assn Of Por
Bought by
Allred R James and Lynne Allred A
Current Estimated Value
Home Financials for this Owner
Home Financials are based on the most recent Mortgage that was taken out on this home.
Original Mortgage
$200,000
Interest Rate
3%
Mortgage Type
Adjustable Rate Mortgage/ARM
Purchase Details
Closed on
Mar 28, 2013
Sold by
Solvik R Sven
Bought by
First Federal Savings & Loan Assn Of Por
Purchase Details
Closed on
Oct 7, 2005
Sold by
Ham & Rye Llc
Bought by
Solvik Sven R
Home Financials for this Owner
Home Financials are based on the most recent Mortgage that was taken out on this home.
Original Mortgage
$375,000
Interest Rate
5.63%
Mortgage Type
New Conventional
Create a Home Valuation Report for This Property
The Home Valuation Report is an in-depth analysis detailing your home's value as well as a comparison with similar homes in the area
Home Values in the Area
Average Home Value in this Area
Purchase History
| Date | Buyer | Sale Price | Title Company |
|---|---|---|---|
| Allred R James | -- | First American Title Of Jeff | |
| Allred R James | -- | First American Title | |
| First Federal Savings & Loan Assn Of Por | -- | Jefferson Title Co Inc | |
| Solvik Sven R | $475,000 | Jefferson Title Co |
Source: Public Records
Mortgage History
| Date | Status | Borrower | Loan Amount |
|---|---|---|---|
| Open | Lynne Allred R | $187,000 | |
| Closed | Allred R James | $200,000 | |
| Previous Owner | Solvik Sven R | $375,000 |
Source: Public Records
Tax History Compared to Growth
Tax History
| Year | Tax Paid | Tax Assessment Tax Assessment Total Assessment is a certain percentage of the fair market value that is determined by local assessors to be the total taxable value of land and additions on the property. | Land | Improvement |
|---|---|---|---|---|
| 2024 | $4,655 | $547,500 | $185,000 | $362,500 |
| 2023 | $4,655 | $518,500 | $185,000 | $333,500 |
| 2022 | $4,428 | $518,500 | $185,000 | $333,500 |
| 2021 | $4,341 | $456,368 | $165,000 | $291,368 |
| 2020 | $4,452 | $431,552 | $154,000 | $277,552 |
| 2019 | $3,722 | $431,552 | $154,000 | $277,552 |
| 2018 | $3,633 | $391,688 | $169,400 | $222,288 |
| 2017 | $3,401 | $334,290 | $127,050 | $207,240 |
| 2016 | $3,270 | $334,290 | $127,050 | $207,240 |
| 2015 | $2,996 | $334,290 | $127,050 | $207,240 |
| 2014 | -- | $303,900 | $115,500 | $188,400 |
| 2013 | -- | $303,900 | $115,500 | $188,400 |
Source: Public Records
Map
Nearby Homes
- 800 Polk St Unit 204C
- 538 Adams St
- 533 Quincy St
- 1127 Adams St
- 301 E St
- 842 Washington St Unit 203
- 842 Washington St Unit 204
- 509 Garfield St
- 1602 Lincoln St
- 410 Lincoln St
- 1055 Monroe St
- 7 XXX Water St
- 702 Water St Unit 1-3
- 537 Jackson St
- 1815 Lawrence St
- 1738 Washington St
- 402 M St
- 999 Reed St
- 2021 Clay St
- 909 & 913 L St
- 940 Lawrence St Unit 303
- 940 Lawrence St Unit 302
- 940 Lawrence St Unit 404
- 940 Lawrence St Unit 1 & 2
- 940 Lawrence St
- 940 Lawrence St
- 940 Lawrence St
- 940 Lawrence St
- 940 Lawrence St
- 940 Lawrence St
- 940 Lawrence St
- 940 Lawrence St Unit 402
- 940 Lawrence St Unit 301
- 724 Tyler St
- 711 Taylor St
- 715 Taylor St
- 0 738 740 Tyler