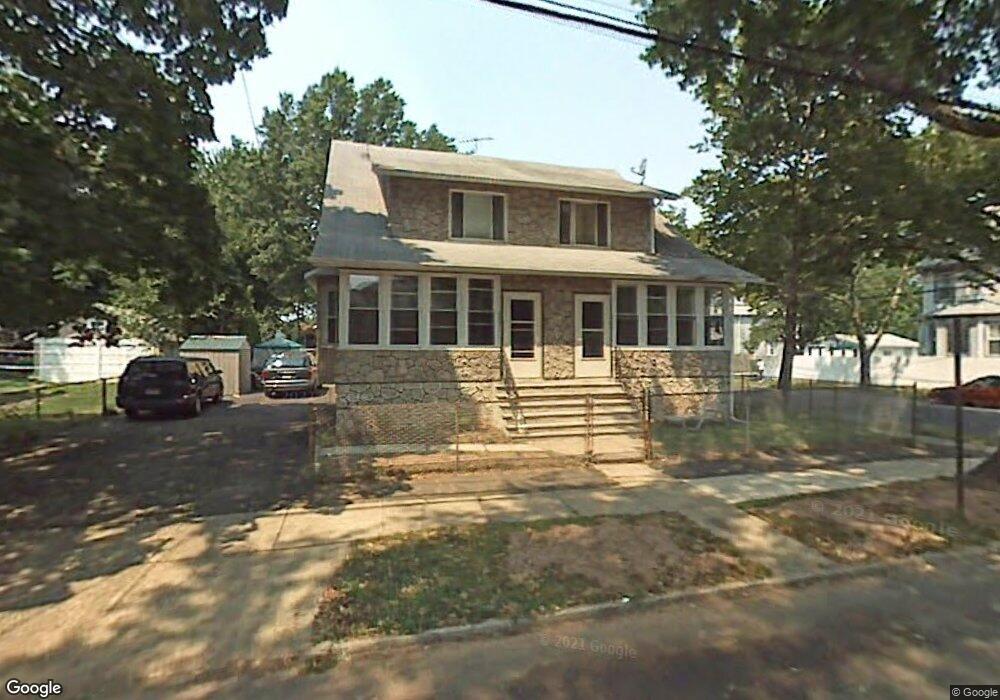
940 Thorn St Unit 944 Rahway, NJ 07065
Estimated Value: $487,000 - $698,000
4
Beds
2
Baths
2,324
Sq Ft
$261/Sq Ft
Est. Value
About This Home
This home is located at 940 Thorn St Unit 944, Rahway, NJ 07065 and is currently estimated at $607,344, approximately $261 per square foot. 940 Thorn St Unit 944 is a home located in Union County with nearby schools including Rahway High School.
Ownership History
Date
Name
Owned For
Owner Type
Purchase Details
Closed on
May 24, 2022
Sold by
Vaughan Gerald
Bought by
Saez Miguel and Maldonado-Saez Geisha
Current Estimated Value
Home Financials for this Owner
Home Financials are based on the most recent Mortgage that was taken out on this home.
Original Mortgage
$375,000
Outstanding Balance
$356,401
Interest Rate
5.3%
Mortgage Type
New Conventional
Estimated Equity
$250,943
Purchase Details
Closed on
Feb 21, 2019
Sold by
Peterson Randall and Peterson Gina
Bought by
Vaughan Gerald
Home Financials for this Owner
Home Financials are based on the most recent Mortgage that was taken out on this home.
Original Mortgage
$407,483
Interest Rate
4.4%
Mortgage Type
FHA
Create a Home Valuation Report for This Property
The Home Valuation Report is an in-depth analysis detailing your home's value as well as a comparison with similar homes in the area
Home Values in the Area
Average Home Value in this Area
Purchase History
| Date | Buyer | Sale Price | Title Company |
|---|---|---|---|
| Saez Miguel | $510,000 | Chicago Title | |
| Saez Miguel | $510,000 | Chicago Title | |
| Vaughan Gerald | $415,000 | None Available |
Source: Public Records
Mortgage History
| Date | Status | Borrower | Loan Amount |
|---|---|---|---|
| Open | Saez Miguel | $375,000 | |
| Closed | Saez Miguel | $375,000 | |
| Previous Owner | Vaughan Gerald | $407,483 |
Source: Public Records
Tax History Compared to Growth
Tax History
| Year | Tax Paid | Tax Assessment Tax Assessment Total Assessment is a certain percentage of the fair market value that is determined by local assessors to be the total taxable value of land and additions on the property. | Land | Improvement |
|---|---|---|---|---|
| 2025 | $11,878 | $160,400 | $48,500 | $111,900 |
| 2024 | $11,504 | $160,400 | $48,500 | $111,900 |
| 2023 | $11,504 | $160,400 | $48,500 | $111,900 |
| 2022 | $11,053 | $157,400 | $48,500 | $108,900 |
| 2021 | $10,941 | $157,400 | $48,500 | $108,900 |
| 2020 | $10,900 | $157,400 | $48,500 | $108,900 |
| 2019 | $10,194 | $149,100 | $48,500 | $100,600 |
| 2018 | $9,979 | $149,100 | $48,500 | $100,600 |
| 2017 | $9,733 | $149,100 | $48,500 | $100,600 |
| 2016 | $9,526 | $149,100 | $48,500 | $100,600 |
| 2015 | $9,419 | $149,100 | $48,500 | $100,600 |
| 2014 | -- | $149,100 | $48,500 | $100,600 |
Source: Public Records
Map
Nearby Homes
- 197 Iva St
- 1025 New Brunswick Ave
- 935 Thorn St
- 276 E Stearns St
- 245 William St
- 280 E Hazelwood Ave
- 48 W Hazelwood Ave
- 1016 Jaques Ave
- 653 New Brunswick Ave
- 139 Maple Ave Unit 104
- 156 W Emerson Ave
- 181 W Stearns St
- 180 W Stearns St
- 182 W Lake Ave
- 1 Carriage City Plaza Unit 1502
- 1 Carriage City Plaza Unit 613
- 1 Carriage City Plaza Unit 1212
- 1 Carriage City Plaza Unit 503
- 1427 Barnhardt Ln Unit 502
- 1435 Barnhardt Ln Unit 604
- 940-944 Thorn St
- 926 Thorn St Unit 28
- 203 E Albert St
- 193 E Albert St
- 962 Thorn St
- 912 Thorn St
- 972 Thorn St
- 183 E Albert St Unit 187
- 183 E Albert St Unit 187
- 183 E Albert St
- 200 E Albert St
- 196 E Albert St
- 941 Thorn St
- 206 E Stearns St
- 927 Thorn St
- 978 Thorn St
- 965 Thorn St
- 184 E Albert St
- 919 Thorn St
- 973 Thorn St