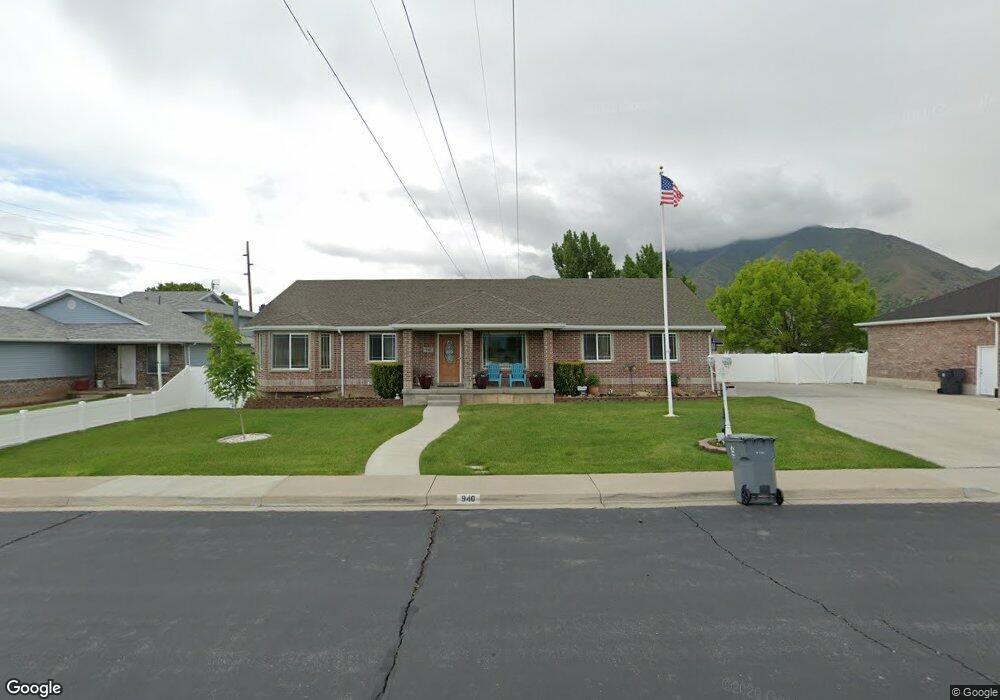
940 W 1800 N Mapleton, UT 84664
Estimated Value: $735,000 - $789,000
3
Beds
2
Baths
2,263
Sq Ft
$334/Sq Ft
Est. Value
About This Home
This home is located at 940 W 1800 N, Mapleton, UT 84664 and is currently estimated at $755,574, approximately $333 per square foot. 940 W 1800 N is a home located in Utah County with nearby schools including Mapleton School, Mapleton Junior High School, and Maple Mountain High School.
Ownership History
Date
Name
Owned For
Owner Type
Purchase Details
Closed on
May 8, 2020
Sold by
Bryant John R and Bryant Jodie L
Bought by
Bryant John R and Bryant Jodie L
Current Estimated Value
Home Financials for this Owner
Home Financials are based on the most recent Mortgage that was taken out on this home.
Original Mortgage
$132,500
Outstanding Balance
$92,681
Interest Rate
3.3%
Mortgage Type
New Conventional
Estimated Equity
$662,893
Purchase Details
Closed on
Jan 17, 2018
Sold by
Bryant John and Bryant Jodie
Bought by
Bryant John R and Bryant Jodie L
Purchase Details
Closed on
Oct 6, 2003
Sold by
Mapleton City
Bought by
Bryant John and Bryant Jodie
Purchase Details
Closed on
Nov 18, 1999
Sold by
S & G Development Lc
Bought by
Mapleton City
Purchase Details
Closed on
Sep 18, 1995
Sold by
York Mary Lynne W and Wheeler Ronald V
Bought by
Seal Zelma T and Seal Zelma Thorpe
Create a Home Valuation Report for This Property
The Home Valuation Report is an in-depth analysis detailing your home's value as well as a comparison with similar homes in the area
Home Values in the Area
Average Home Value in this Area
Purchase History
| Date | Buyer | Sale Price | Title Company |
|---|---|---|---|
| Bryant John R | -- | Cottonwood Ttl Ins Agcy Inc | |
| Bryant John R | -- | Cottonwood Ttl Ins Agcy Inc | |
| Bryant John R | -- | None Available | |
| Bryant John | -- | Horizon Title | |
| Mapleton City | -- | Security Title & Abstract | |
| Seal Zelma T | -- | -- |
Source: Public Records
Mortgage History
| Date | Status | Borrower | Loan Amount |
|---|---|---|---|
| Open | Bryant John R | $132,500 |
Source: Public Records
Tax History
| Year | Tax Paid | Tax Assessment Tax Assessment Total Assessment is a certain percentage of the fair market value that is determined by local assessors to be the total taxable value of land and additions on the property. | Land | Improvement |
|---|---|---|---|---|
| 2025 | $3,709 | $399,025 | -- | -- |
| 2024 | $3,709 | $363,385 | $0 | $0 |
| 2023 | $3,861 | $380,600 | $0 | $0 |
| 2022 | $4,061 | $395,835 | $0 | $0 |
| 2021 | $3,056 | $457,400 | $171,200 | $286,200 |
| 2020 | $3,024 | $437,700 | $151,500 | $286,200 |
| 2019 | $2,669 | $394,300 | $145,400 | $248,900 |
| 2018 | $2,562 | $360,400 | $122,400 | $238,000 |
| 2017 | $2,599 | $194,040 | $0 | $0 |
| 2016 | $2,558 | $189,805 | $0 | $0 |
| 2015 | $2,275 | $167,805 | $0 | $0 |
| 2014 | $2,186 | $158,345 | $0 | $0 |
Source: Public Records
Map
Nearby Homes
- 1121 W 1800 N
- 598 W 1600 N
- 1697 N 500 W
- 949 S 1060 E
- 405 W 1200 N Unit 4
- 487 W 1200 N Unit 1
- 145 W Carnesecca Ct
- 1403 S 625 E
- 1225 N 1380 W
- 1518 E Pheasant Run Dr
- 1410 W 1200 N
- 1618 E 970 S
- 1518 S 600 E
- 1525 S 400 E Unit 36
- 1350 N Main St
- 883 E 700 S
- 677 E 800 South St
- 667 N 550 W
- 66 E 750 S Unit 23
- 1839 River Bottom Rd
Your Personal Tour Guide
Ask me questions while you tour the home.