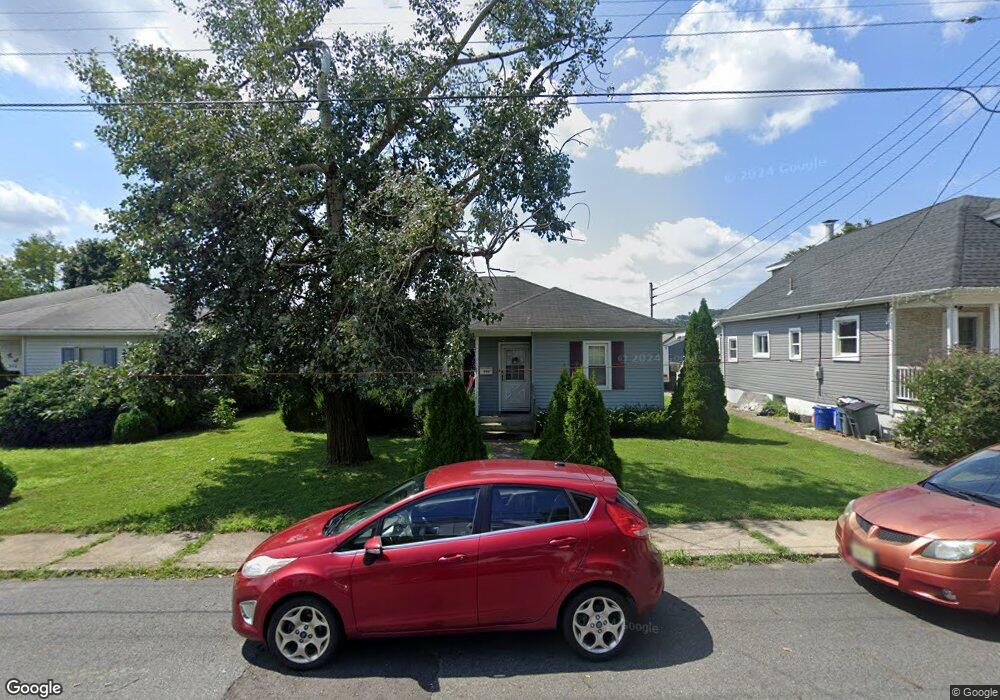
940 Wilbur Ave Phillipsburg, NJ 08865
Estimated Value: $238,000 - $330,000
--
Bed
--
Bath
932
Sq Ft
$298/Sq Ft
Est. Value
About This Home
This home is located at 940 Wilbur Ave, Phillipsburg, NJ 08865 and is currently estimated at $278,124, approximately $298 per square foot. 940 Wilbur Ave is a home located in Warren County with nearby schools including Phillipsburg High School, Easton Arts Academy Elementary Cs, and Sts. Philip & James School.
Ownership History
Date
Name
Owned For
Owner Type
Purchase Details
Closed on
Dec 24, 2004
Sold by
Martino Jack F and Martino Diane E
Bought by
Martino Jack F
Current Estimated Value
Home Financials for this Owner
Home Financials are based on the most recent Mortgage that was taken out on this home.
Original Mortgage
$89,534
Interest Rate
6.28%
Mortgage Type
New Conventional
Purchase Details
Closed on
Sep 2, 1993
Sold by
Schmidt Randall J
Bought by
Martino Jack F
Home Financials for this Owner
Home Financials are based on the most recent Mortgage that was taken out on this home.
Original Mortgage
$84,000
Interest Rate
7.1%
Create a Home Valuation Report for This Property
The Home Valuation Report is an in-depth analysis detailing your home's value as well as a comparison with similar homes in the area
Home Values in the Area
Average Home Value in this Area
Purchase History
| Date | Buyer | Sale Price | Title Company |
|---|---|---|---|
| Martino Jack F | -- | None Available | |
| Martino Jack F | $106,000 | -- |
Source: Public Records
Mortgage History
| Date | Status | Borrower | Loan Amount |
|---|---|---|---|
| Closed | Martino Jack F | $89,534 | |
| Closed | Martino Jack F | $84,000 |
Source: Public Records
Tax History Compared to Growth
Tax History
| Year | Tax Paid | Tax Assessment Tax Assessment Total Assessment is a certain percentage of the fair market value that is determined by local assessors to be the total taxable value of land and additions on the property. | Land | Improvement |
|---|---|---|---|---|
| 2025 | $4,586 | $100,900 | $35,300 | $65,600 |
| 2024 | $4,234 | $100,900 | $35,300 | $65,600 |
| 2023 | $4,185 | $100,900 | $35,300 | $65,600 |
| 2022 | $4,185 | $100,900 | $35,300 | $65,600 |
| 2021 | $4,051 | $100,900 | $35,300 | $65,600 |
| 2020 | $4,078 | $100,900 | $35,300 | $65,600 |
| 2019 | $4,017 | $100,900 | $35,300 | $65,600 |
| 2018 | $4,017 | $100,900 | $35,300 | $65,600 |
| 2017 | $3,999 | $100,900 | $35,300 | $65,600 |
| 2016 | $3,937 | $100,900 | $35,300 | $65,600 |
| 2015 | $3,907 | $100,900 | $35,300 | $65,600 |
| 2014 | $3,780 | $100,900 | $35,300 | $65,600 |
Source: Public Records
Map
Nearby Homes