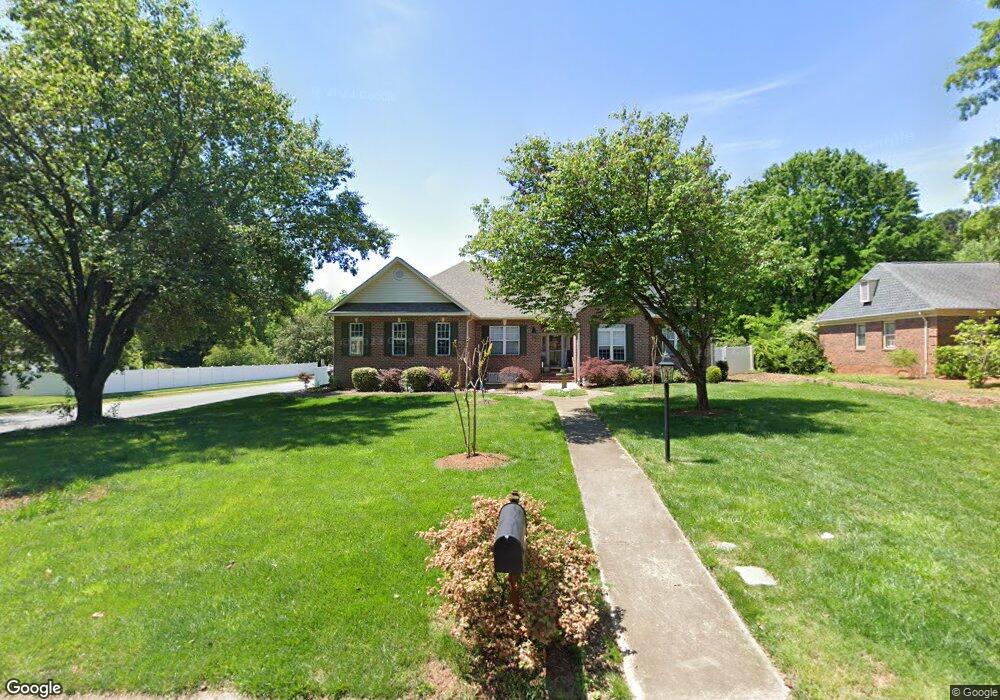
9401 Magnolia Estates Dr Cornelius, NC 28031
Estimated Value: $528,000 - $647,000
4
Beds
3
Baths
2,004
Sq Ft
$296/Sq Ft
Est. Value
About This Home
This home is located at 9401 Magnolia Estates Dr, Cornelius, NC 28031 and is currently estimated at $593,825, approximately $296 per square foot. 9401 Magnolia Estates Dr is a home located in Mecklenburg County with nearby schools including Cornelius Elementary School, Bailey Middle School, and William Amos Hough High School.
Ownership History
Date
Name
Owned For
Owner Type
Purchase Details
Closed on
Jun 17, 2010
Sold by
Neal Whitman A and Neal Dianne Rene
Bought by
Briggs Richard Wayne and Briggs Robert Otis
Current Estimated Value
Purchase Details
Closed on
Mar 25, 2010
Sold by
Neal Whitman A
Bought by
Neal Whitman A
Purchase Details
Closed on
Apr 25, 2008
Sold by
Seward Merton H and Seward Faith
Bought by
Neal Jerome Franklin and Neal Peggy Jean
Purchase Details
Closed on
Feb 11, 2005
Sold by
Vlahos George P and Vlahos Betsy G
Bought by
Seward Merton H and Seward Faith L
Home Financials for this Owner
Home Financials are based on the most recent Mortgage that was taken out on this home.
Original Mortgage
$168,750
Interest Rate
5.69%
Mortgage Type
Purchase Money Mortgage
Purchase Details
Closed on
Jan 19, 2000
Sold by
Magnolia Estates
Bought by
George Reverend and Vlahos Betsy
Create a Home Valuation Report for This Property
The Home Valuation Report is an in-depth analysis detailing your home's value as well as a comparison with similar homes in the area
Home Values in the Area
Average Home Value in this Area
Purchase History
| Date | Buyer | Sale Price | Title Company |
|---|---|---|---|
| Briggs Richard Wayne | $256,600 | Master Title | |
| Neal Whitman A | -- | None Available | |
| Neal Jerome Franklin | $263,000 | None Available | |
| Seward Merton H | $225,000 | -- | |
| George Reverend | $31,000 | -- |
Source: Public Records
Mortgage History
| Date | Status | Borrower | Loan Amount |
|---|---|---|---|
| Previous Owner | Seward Merton H | $168,750 |
Source: Public Records
Tax History Compared to Growth
Tax History
| Year | Tax Paid | Tax Assessment Tax Assessment Total Assessment is a certain percentage of the fair market value that is determined by local assessors to be the total taxable value of land and additions on the property. | Land | Improvement |
|---|---|---|---|---|
| 2025 | $3,018 | $452,400 | $100,000 | $352,400 |
| 2024 | $3,018 | $452,400 | $100,000 | $352,400 |
| 2023 | $2,968 | $452,400 | $100,000 | $352,400 |
| 2022 | $2,595 | $301,000 | $95,000 | $206,000 |
| 2021 | $2,565 | $301,000 | $95,000 | $206,000 |
| 2020 | $2,565 | $301,000 | $95,000 | $206,000 |
| 2019 | $2,559 | $301,000 | $95,000 | $206,000 |
| 2018 | $2,748 | $252,300 | $75,000 | $177,300 |
| 2017 | $2,725 | $252,300 | $75,000 | $177,300 |
| 2016 | $2,626 | $243,300 | $75,000 | $168,300 |
| 2015 | $2,586 | $243,300 | $75,000 | $168,300 |
| 2014 | $2,584 | $0 | $0 | $0 |
Source: Public Records
Map
Nearby Homes
- 19403 Greentree Way
- 9053 Rosalyn Glen Rd
- 9047 Rosalyn Glen Rd
- 19711 Bethel Church Rd
- 8722 Westmoreland Lake Dr
- 18800 Nantz Rd
- 8532 Westmoreland Lake Dr
- 16116 Lakeside Loop Ln
- 9415 Rosalyn Glen Rd
- 19241 Lake Norman Cove Dr
- 17834 Jetton Green Loop Unit 20
- 19005 Northport Dr
- 16215 Lakeside Loop Ln
- 20028 Northport Dr
- 20015 N Cove Rd
- 19307 Beaufain St Unit 14
- 8920 Lake Pines Dr
- 8326 Viewpoint Ln Unit 802
- 19901 Henderson Rd Unit C
- 19329 Watermark Dr Unit 551
- 9409 Magnolia Estates Dr
- 0 Barnhardt Rd Unit 782658
- 0 Courtside Cove Ln Unit 15016 3141688
- 0 Barnhardt Rd Unit 2094761
- 20939 Cinnamon Tree Ln
- 20939 Cinnamon Tree Ln Unit 4
- 0 Courtside Cove Ln Unit 50
- 0 Courtside Cove Ln Unit 51
- 0 Courtside Cove Ln Unit 52
- 0 Courtside Cove Ln Unit 53
- 0 Courtside Cove Ln Unit 49
- 0 Courtside Cove Ln Unit 46
- 0 Courtside Cove Ln Unit 45
- 48 Courtside Cove Ln Unit 48
- 42 Courtside Landing Dr Unit 42
- 62 Courtside Landing Dr Unit 62
- 47 Courtside Cove Ln Unit 47
- 9323 Magnolia Estates Dr
- 9417 Magnolia Estates Dr
- 9400 Magnolia Estates Dr