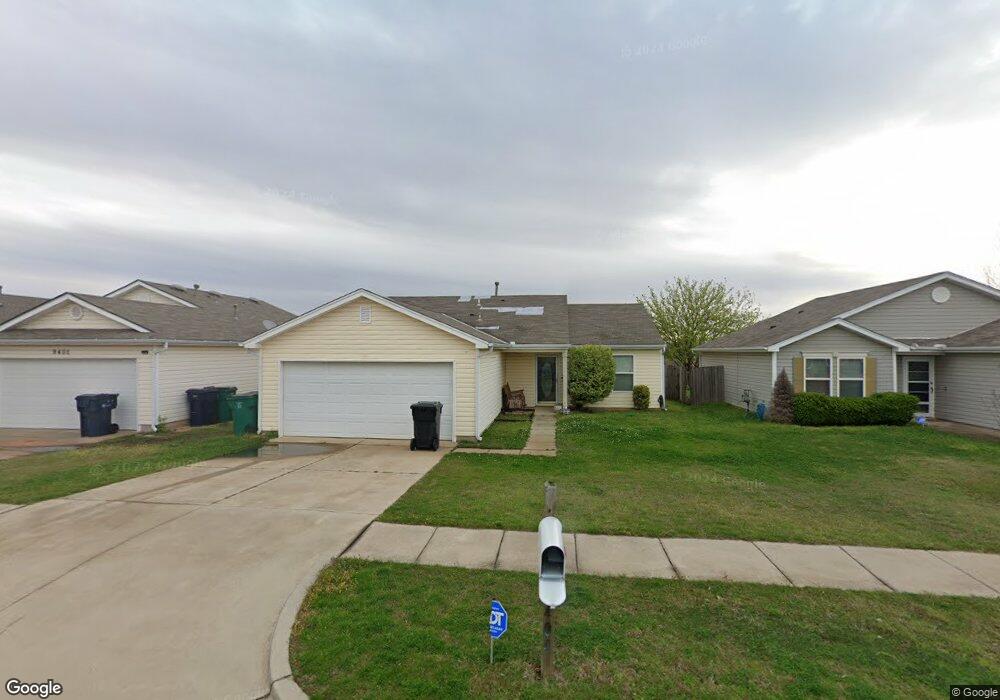
9404 Checkerbloom Dr Oklahoma City, OK 73165
Estimated Value: $190,723 - $204,000
3
Beds
2
Baths
1,260
Sq Ft
$158/Sq Ft
Est. Value
About This Home
This home is located at 9404 Checkerbloom Dr, Oklahoma City, OK 73165 and is currently estimated at $199,431, approximately $158 per square foot. 9404 Checkerbloom Dr is a home located in Cleveland County with nearby schools including Sooner Elementary School, Central Junior High School, and Moore High School.
Ownership History
Date
Name
Owned For
Owner Type
Purchase Details
Closed on
Mar 18, 2019
Sold by
Combs Helen G
Bought by
Grc Investments Llc
Current Estimated Value
Purchase Details
Closed on
Dec 28, 2018
Sold by
Grc Investments Llc
Bought by
Combs Helen G
Home Financials for this Owner
Home Financials are based on the most recent Mortgage that was taken out on this home.
Original Mortgage
$65,900
Interest Rate
4.8%
Mortgage Type
New Conventional
Purchase Details
Closed on
Mar 31, 2006
Sold by
Ideal Homes Of Norman Lp
Bought by
Grc Investments Llc
Home Financials for this Owner
Home Financials are based on the most recent Mortgage that was taken out on this home.
Original Mortgage
$88,908
Interest Rate
6.22%
Mortgage Type
Commercial
Purchase Details
Closed on
Aug 15, 2005
Sold by
Vero Investments Llc
Bought by
Ieal Homes Of Norman Lp
Create a Home Valuation Report for This Property
The Home Valuation Report is an in-depth analysis detailing your home's value as well as a comparison with similar homes in the area
Home Values in the Area
Average Home Value in this Area
Purchase History
| Date | Buyer | Sale Price | Title Company |
|---|---|---|---|
| Grc Investments Llc | -- | None Available | |
| Combs Helen G | -- | Guaranty Abstract Co | |
| Grc Investments Llc | -- | None Available | |
| Ieal Homes Of Norman Lp | $165,000 | None Available |
Source: Public Records
Mortgage History
| Date | Status | Borrower | Loan Amount |
|---|---|---|---|
| Previous Owner | Combs Helen G | $65,900 | |
| Previous Owner | Grc Investments Llc | $88,908 |
Source: Public Records
Tax History Compared to Growth
Tax History
| Year | Tax Paid | Tax Assessment Tax Assessment Total Assessment is a certain percentage of the fair market value that is determined by local assessors to be the total taxable value of land and additions on the property. | Land | Improvement |
|---|---|---|---|---|
| 2024 | $1,865 | $15,319 | $3,284 | $12,035 |
| 2023 | $1,784 | $14,590 | $3,390 | $11,200 |
| 2022 | $1,721 | $13,895 | $2,920 | $10,975 |
| 2021 | $1,635 | $13,233 | $3,195 | $10,038 |
| 2020 | $1,564 | $12,603 | $1,740 | $10,863 |
| 2019 | $1,581 | $12,603 | $1,740 | $10,863 |
| 2018 | $1,599 | $12,604 | $1,740 | $10,864 |
| 2017 | $1,601 | $12,604 | $0 | $0 |
| 2016 | $1,618 | $12,604 | $1,740 | $10,864 |
| 2015 | -- | $12,604 | $1,740 | $10,864 |
| 2014 | -- | $12,123 | $1,740 | $10,383 |
Source: Public Records
Map
Nearby Homes
- 9416 Checkerbloom Dr
- 9233 Snowberry Dr
- 5308 SE 88th St
- 4900 SE 88th Terrace
- 8709 Woodbend Dr
- 8701 Woodbend Dr
- 5308 SE 87th St
- 5105 SE 86th St
- 5401 SE 86th St
- 4836 SE 85th Terrace
- 5305 SE 85th St
- 5807 Bluewater Rd
- 8512 Bigwood Dr
- 8404 Pinewood Dr
- 8708 Lilly Ln
- 8401 Azurewood Dr
- 5717 SE 86th St
- 5725 SE 86th St
- 4124 E Horseshoe Ln
- 5009 SE 83rd Place
- 9400 Checkerbloom Dr
- 9408 Checkerbloom Dr
- 9320 Checkerbloom Dr
- 9412 Checkerbloom Dr
- 9316 Checkerbloom Dr
- 9405 Checkerbloom Dr
- 9401 Checkerbloom Dr
- 9409 Checkerbloom Dr
- 9413 Checkerbloom Dr
- 9312 Checkerbloom Dr
- 9317 Checkerbloom Dr
- 9420 Checkerbloom Dr
- 9417 Checkerbloom Dr
- 9308 Checkerbloom Dr
- 9424 Checkerbloom Dr
- 9313 Checkerbloom Dr
- 9421 Checkerbloom Dr
- 9309 Checkerbloom Dr
- 5100 SE 92nd St
- 5104 SE 92nd St