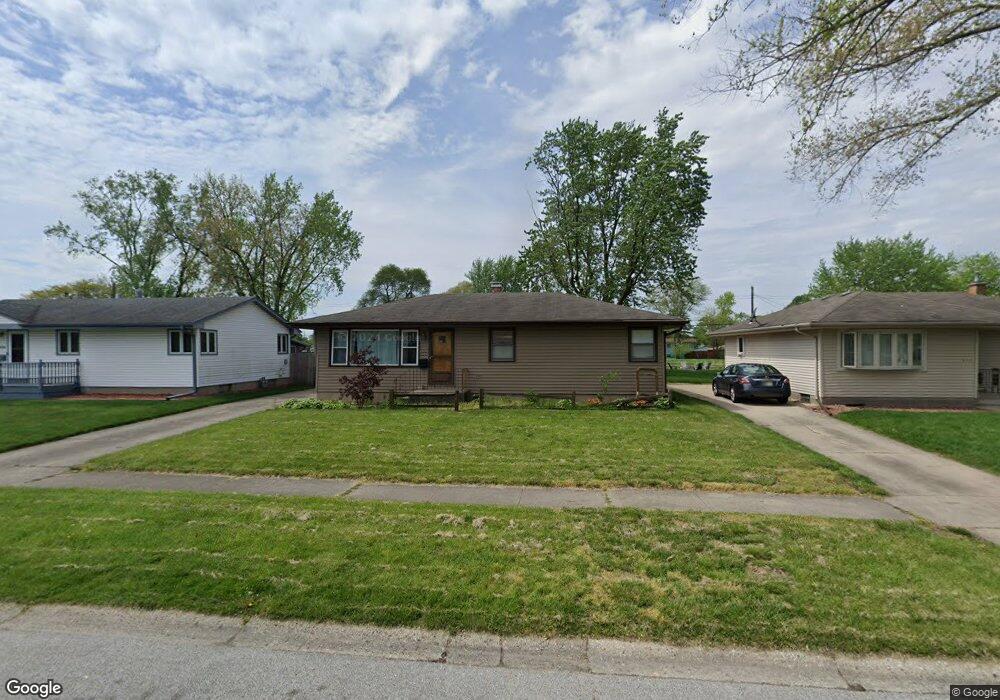
9404 O Day Dr Highland, IN 46322
Estimated Value: $235,482 - $269,000
3
Beds
1
Bath
1,008
Sq Ft
$252/Sq Ft
Est. Value
About This Home
This home is located at 9404 O Day Dr, Highland, IN 46322 and is currently estimated at $254,121, approximately $252 per square foot. 9404 O Day Dr is a home located in Lake County with nearby schools including Highland High School, Highland Christian School, and Calumet Christian School.
Ownership History
Date
Name
Owned For
Owner Type
Purchase Details
Closed on
Apr 29, 2019
Sold by
Lyons Duane V and Lyons Tina Lee
Bought by
Lyons Justin H
Current Estimated Value
Home Financials for this Owner
Home Financials are based on the most recent Mortgage that was taken out on this home.
Original Mortgage
$147,283
Interest Rate
4.75%
Mortgage Type
FHA
Create a Home Valuation Report for This Property
The Home Valuation Report is an in-depth analysis detailing your home's value as well as a comparison with similar homes in the area
Home Values in the Area
Average Home Value in this Area
Purchase History
| Date | Buyer | Sale Price | Title Company |
|---|---|---|---|
| Lyons Justin H | -- | Meridian Title Corp |
Source: Public Records
Mortgage History
| Date | Status | Borrower | Loan Amount |
|---|---|---|---|
| Closed | Lyons Justin H | $147,283 |
Source: Public Records
Tax History Compared to Growth
Tax History
| Year | Tax Paid | Tax Assessment Tax Assessment Total Assessment is a certain percentage of the fair market value that is determined by local assessors to be the total taxable value of land and additions on the property. | Land | Improvement |
|---|---|---|---|---|
| 2024 | $2,338 | $224,800 | $46,600 | $178,200 |
| 2023 | $2,094 | $209,800 | $46,600 | $163,200 |
| 2022 | $2,094 | $209,400 | $46,600 | $162,800 |
| 2021 | $1,755 | $175,500 | $24,500 | $151,000 |
| 2020 | $1,640 | $169,800 | $24,500 | $145,300 |
| 2019 | $1,562 | $159,500 | $24,500 | $135,000 |
| 2018 | $1,563 | $156,000 | $24,500 | $131,500 |
| 2017 | $1,526 | $151,200 | $24,500 | $126,700 |
| 2016 | $1,477 | $148,800 | $24,500 | $124,300 |
| 2014 | $1,345 | $151,000 | $24,500 | $126,500 |
| 2013 | $1,218 | $144,800 | $24,500 | $120,300 |
Source: Public Records
Map
Nearby Homes
- 9414 Saric Dr
- 9307 Grace St
- 9343 Saric Dr
- 3210 O Day Dr
- 3443 43rd St
- 3136 Lois Place
- 9132 Highland St
- 3538 41st St
- 3122 44th St
- 3439 Martha St
- 9624 O Day Dr
- 3631 Manor Dr
- 2741 41st St
- 1951 W Ash St
- 9035 O Day Dr
- 8945 Cottage Grove Ave
- 8939 Parrish Ave
- 3737 41st Ln
- 929 W Glen Park Ave Unit 304
- 8951 O Day Dr