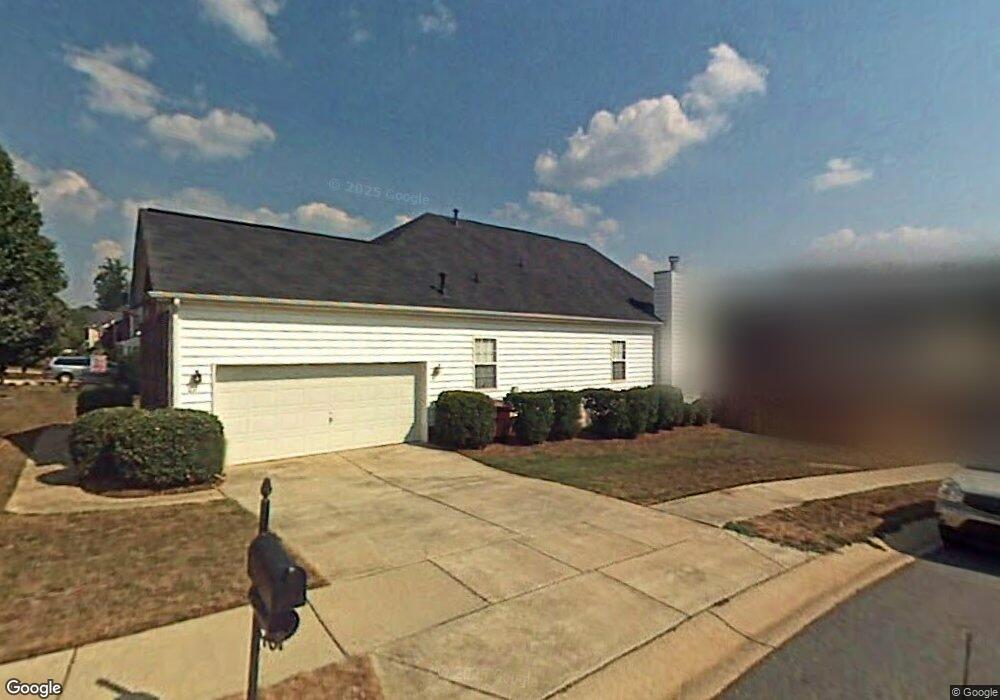
9404 Shepparton Dr Huntersville, NC 28078
Estimated Value: $467,000 - $554,000
4
Beds
2
Baths
2,178
Sq Ft
$226/Sq Ft
Est. Value
About This Home
This home is located at 9404 Shepparton Dr, Huntersville, NC 28078 and is currently estimated at $492,782, approximately $226 per square foot. 9404 Shepparton Dr is a home located in Mecklenburg County with nearby schools including Torrence Creek Elementary School, Francis Bradley Middle School, and Hopewell High.
Ownership History
Date
Name
Owned For
Owner Type
Purchase Details
Closed on
Apr 12, 2018
Sold by
Cole Karen A
Bought by
Cole Karen Annette and Karen Annette Cole Revocable Living Tru
Current Estimated Value
Purchase Details
Closed on
Jan 1, 2000
Sold by
Cole Geneva J and Cole Larry Vernon
Bought by
Cole Karen A
Purchase Details
Closed on
Nov 25, 1998
Sold by
Beazer Homes Corp
Bought by
Cole Karen A and Cole Geneva J
Home Financials for this Owner
Home Financials are based on the most recent Mortgage that was taken out on this home.
Original Mortgage
$182,200
Outstanding Balance
$41,995
Interest Rate
6.95%
Mortgage Type
Purchase Money Mortgage
Estimated Equity
$450,787
Purchase Details
Closed on
Aug 28, 1998
Sold by
Landcraft Properties Inc
Bought by
Beazer Homes Corp and Squires Homes
Create a Home Valuation Report for This Property
The Home Valuation Report is an in-depth analysis detailing your home's value as well as a comparison with similar homes in the area
Home Values in the Area
Average Home Value in this Area
Purchase History
| Date | Buyer | Sale Price | Title Company |
|---|---|---|---|
| Cole Karen Annette | -- | None Available | |
| Cole Karen A | -- | -- | |
| Cole Karen A | $192,000 | -- | |
| Beazer Homes Corp | $28,000 | -- |
Source: Public Records
Mortgage History
| Date | Status | Borrower | Loan Amount |
|---|---|---|---|
| Open | Cole Karen A | $182,200 |
Source: Public Records
Tax History Compared to Growth
Tax History
| Year | Tax Paid | Tax Assessment Tax Assessment Total Assessment is a certain percentage of the fair market value that is determined by local assessors to be the total taxable value of land and additions on the property. | Land | Improvement |
|---|---|---|---|---|
| 2025 | $3,397 | $449,400 | $80,000 | $369,400 |
| 2024 | $3,397 | $449,400 | $80,000 | $369,400 |
| 2023 | $3,116 | $449,400 | $80,000 | $369,400 |
| 2022 | $2,461 | $267,900 | $60,000 | $207,900 |
| 2021 | $2,416 | $264,600 | $60,000 | $204,600 |
| 2020 | $2,391 | $264,600 | $60,000 | $204,600 |
| 2019 | $2,385 | $264,600 | $60,000 | $204,600 |
| 2018 | $2,383 | $201,300 | $40,000 | $161,300 |
| 2017 | $2,352 | $201,300 | $40,000 | $161,300 |
| 2016 | $2,348 | $201,300 | $40,000 | $161,300 |
| 2015 | $2,345 | $201,300 | $40,000 | $161,300 |
| 2014 | $2,343 | $0 | $0 | $0 |
Source: Public Records
Map
Nearby Homes
- 6412, 6512 & 6520 Gilead Rd
- 13801 Holly Stream Dr
- 9358 Greenheather Dr
- 9003 Maple Hill Ct
- 12415 Bluff Meadow Trail
- 13016 Meadowmere Rd
- 00 Stratton Farm Rd
- 12804 Windyedge Rd
- 12450 Stone Garden Dr
- 8909 Abberley Ct
- 9616 Mendenhall View Dr
- 12323 Cross Meadow Rd
- 9000 Stourbridge Dr
- 9658 Blossom Hill Dr
- 9754 Blossom Hill Dr
- 12904 Windy Lea Ln
- 9534 Blossom Hill Dr
- 9927 Ansonborough Square
- 9923 Ansonborough Square
- 9921 Ansonborough Square
- 9407 Hillston Ridge Rd
- 9411 Hillston Ridge Rd
- 9340 Culcairn Rd
- 9416 Culcairn Rd
- 9395 Hillston Ridge Rd
- 9403 Culcairn Rd
- 9419 Hillston Ridge Rd
- 9409 Culcairn Rd
- 9336 Culcairn Rd
- 9422 Culcairn Rd
- 9339 Culcairn Rd
- 9415 Culcairn Rd
- 9423 Hillston Ridge Rd
- 9391 Hillston Ridge Rd
- 9335 Culcairn Rd
- 9332 Culcairn Rd
- 9408 Hillston Ridge Rd
- 9421 Culcairn Rd
- 9424 Hillston Ridge Rd
- 9428 Culcairn Rd