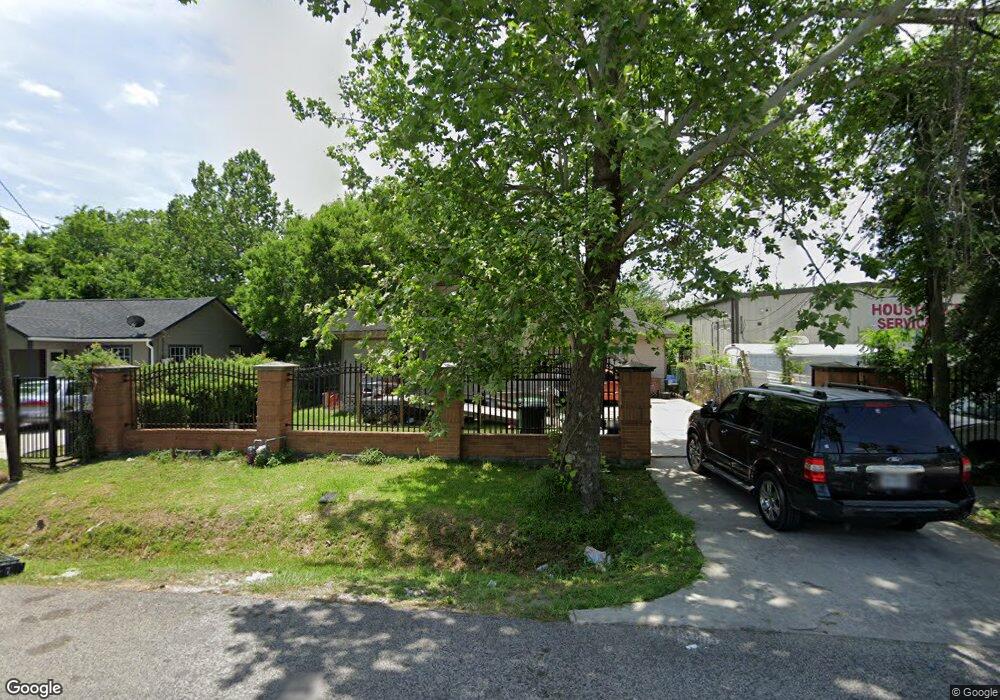
9407 Shoreham St Houston, TX 77093
Eastex-Jensen NeighborhoodEstimated Value: $176,157 - $222,000
3
Beds
1
Bath
1,414
Sq Ft
$140/Sq Ft
Est. Value
About This Home
This home is located at 9407 Shoreham St, Houston, TX 77093 and is currently estimated at $197,289, approximately $139 per square foot. 9407 Shoreham St is a home located in Harris County with nearby schools including Garcia Elementary School, Patrick Henry Middle School, and Sam Houston Math, Science & Technology Center.
Ownership History
Date
Name
Owned For
Owner Type
Purchase Details
Closed on
Oct 18, 2012
Sold by
Olvera Juan and Palomares Claudia
Bought by
Valles Juan A
Current Estimated Value
Home Financials for this Owner
Home Financials are based on the most recent Mortgage that was taken out on this home.
Original Mortgage
$153,000
Outstanding Balance
$26,411
Interest Rate
3.55%
Mortgage Type
Purchase Money Mortgage
Estimated Equity
$170,878
Purchase Details
Closed on
Jul 30, 2000
Sold by
J A Drake Companies Inc
Bought by
Valles Juan A and Valles Maria G
Home Financials for this Owner
Home Financials are based on the most recent Mortgage that was taken out on this home.
Original Mortgage
$10,000
Interest Rate
12%
Mortgage Type
Seller Take Back
Purchase Details
Closed on
Jun 2, 1999
Sold by
Randolph Nevie Lorrine and Randolph Nevie Lorine
Bought by
J A Drake Companies Inc
Create a Home Valuation Report for This Property
The Home Valuation Report is an in-depth analysis detailing your home's value as well as a comparison with similar homes in the area
Home Values in the Area
Average Home Value in this Area
Purchase History
| Date | Buyer | Sale Price | Title Company |
|---|---|---|---|
| Valles Juan A | -- | None Available | |
| Valles Juan A | -- | -- | |
| J A Drake Companies Inc | -- | Regency Title Company |
Source: Public Records
Mortgage History
| Date | Status | Borrower | Loan Amount |
|---|---|---|---|
| Open | Valles Juan A | $153,000 | |
| Previous Owner | Valles Juan A | $10,000 |
Source: Public Records
Tax History Compared to Growth
Tax History
| Year | Tax Paid | Tax Assessment Tax Assessment Total Assessment is a certain percentage of the fair market value that is determined by local assessors to be the total taxable value of land and additions on the property. | Land | Improvement |
|---|---|---|---|---|
| 2025 | $3,336 | $189,425 | $46,217 | $143,208 |
| 2024 | $3,336 | $159,456 | $40,572 | $118,884 |
| 2023 | $3,336 | $142,545 | $40,572 | $101,973 |
| 2022 | $2,585 | $117,386 | $26,460 | $90,926 |
| 2021 | $2,605 | $111,766 | $26,460 | $85,306 |
| 2020 | $2,442 | $100,832 | $26,460 | $74,372 |
| 2019 | $1,691 | $66,842 | $14,112 | $52,730 |
| 2018 | $1,691 | $66,842 | $14,112 | $52,730 |
| 2017 | $1,690 | $66,842 | $14,112 | $52,730 |
| 2016 | $1,690 | $66,842 | $14,112 | $52,730 |
| 2015 | $1,404 | $70,034 | $14,112 | $55,922 |
| 2014 | $1,404 | $90,316 | $14,112 | $76,204 |
Source: Public Records
Map
Nearby Homes
- 3614 Tidwell Rd
- 3110 Tidwell Rd
- 2919 La Estancia Ln
- 8418 Jensen Dr
- 9021 Lomax St
- 9630 Burden St
- 9634 Burden St
- 3302 Sparks St
- 8917 Etta St Unit A
- 8718 Brannon St
- 2633 Hollis St
- 2900 Luell St
- 9009 Ramin Dr
- 3202 Laura Koppe Rd
- 2823 Berry Rd
- 8814 Manus St Unit 1-11
- 2630 Keeland St
- 3810 Hurley St
- 2608 Bostic St
- 1731 Schilder Dr
- 9405 Shoreham St
- 9403 Shoreham St
- 9401 Shoreham St
- 9322 Shoreham St
- 2627 Tidwell Rd Unit F
- 9313 Shoreham St
- 9318 Shoreham St
- 9314 Shoreham St
- 9310 Shoreham St
- 9310 Shoreham St
- 9305 Shoreham St
- 9306 Shoreham St
- 9303 Shoreham St
- 9505 Shoreham St
- 9505 Shoreham St Unit A & B
- 9505 Shoreham St Unit A
- 9506 Coan St
- 2509 Tidwell Rd Unit 1
- 9302 Shoreham St
- 9512 Coan St