9409 Ivy Brook Run Unit 1302 Fort Myers, FL 33913
Gateway NeighborhoodEstimated Value: $177,046 - $198,000
3
Beds
3
Baths
1,830
Sq Ft
$103/Sq Ft
Est. Value
About This Home
This home is located at 9409 Ivy Brook Run Unit 1302, Fort Myers, FL 33913 and is currently estimated at $188,762, approximately $103 per square foot. 9409 Ivy Brook Run Unit 1302 is a home located in Lee County with nearby schools including Gateway Elementary School, Tice Elementary School, and Orange River Elementary School.
Ownership History
Date
Name
Owned For
Owner Type
Purchase Details
Closed on
Mar 11, 2014
Sold by
Chau Van and Waas John
Bought by
Chau & Waas Property Investment 1 Llc
Current Estimated Value
Purchase Details
Closed on
Sep 30, 2010
Sold by
Hsbc Bank Usa National Association
Bought by
Waas John and Chu Van
Purchase Details
Closed on
Jul 13, 2010
Sold by
Molano Victor M and Molano Victor
Bought by
Hsbc Bank Usa National Association
Purchase Details
Closed on
Jan 31, 2007
Sold by
U S Homes Corp
Bought by
Molano Victor M
Home Financials for this Owner
Home Financials are based on the most recent Mortgage that was taken out on this home.
Original Mortgage
$204,516
Interest Rate
6.07%
Mortgage Type
Unknown
Create a Home Valuation Report for This Property
The Home Valuation Report is an in-depth analysis detailing your home's value as well as a comparison with similar homes in the area
Home Values in the Area
Average Home Value in this Area
Purchase History
| Date | Buyer | Sale Price | Title Company |
|---|---|---|---|
| Chau & Waas Property Investment 1 Llc | -- | Attorney | |
| Waas John | $50,500 | Rels Title | |
| Hsbc Bank Usa National Association | -- | None Available | |
| Molano Victor M | $215,300 | First Choice Title Group Llc |
Source: Public Records
Mortgage History
| Date | Status | Borrower | Loan Amount |
|---|---|---|---|
| Previous Owner | Molano Victor M | $204,516 |
Source: Public Records
Tax History Compared to Growth
Tax History
| Year | Tax Paid | Tax Assessment Tax Assessment Total Assessment is a certain percentage of the fair market value that is determined by local assessors to be the total taxable value of land and additions on the property. | Land | Improvement |
|---|---|---|---|---|
| 2025 | $3,125 | $149,065 | -- | $149,065 |
| 2024 | $2,982 | $149,500 | -- | -- |
| 2023 | $2,982 | $135,909 | $0 | $0 |
| 2022 | $2,500 | $123,554 | $0 | $0 |
| 2021 | $2,199 | $112,322 | $0 | $112,322 |
| 2020 | $2,106 | $105,783 | $0 | $105,783 |
| 2019 | $2,216 | $106,590 | $0 | $106,590 |
| 2018 | $2,097 | $100,130 | $0 | $100,130 |
| 2017 | $1,937 | $94,478 | $0 | $94,478 |
| 2016 | $1,781 | $89,641 | $0 | $89,641 |
| 2015 | $1,564 | $73,300 | $0 | $73,300 |
| 2014 | $1,246 | $68,100 | $0 | $68,100 |
| 2013 | -- | $55,100 | $0 | $55,100 |
Source: Public Records
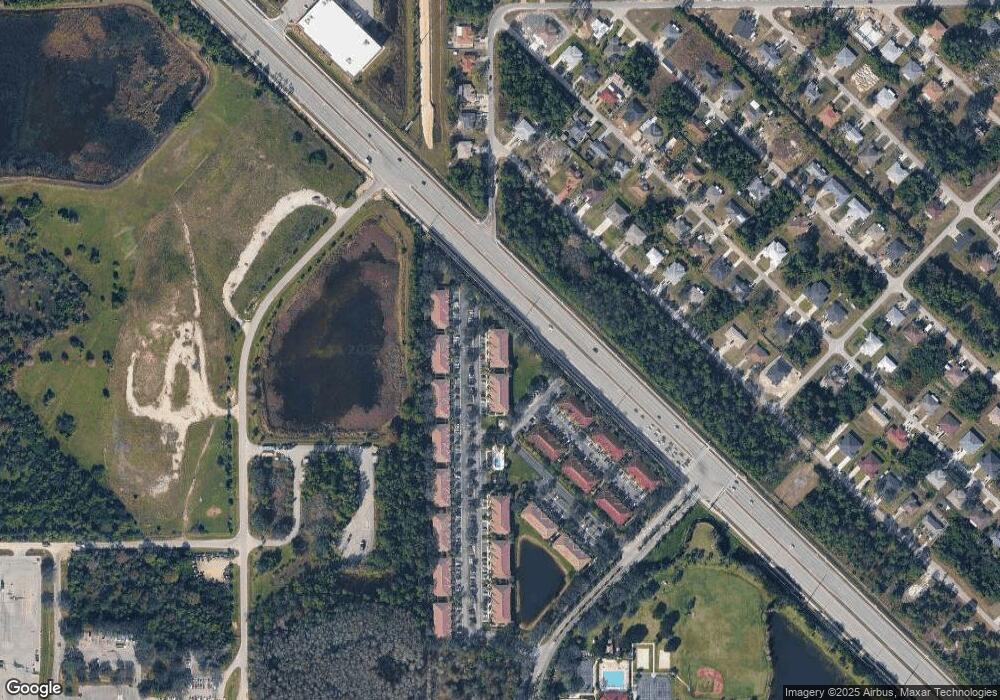
Map
Nearby Homes
- 9419 Ivy Brook Run Unit 1206
- 9409 Ivy Brook Run Unit 1306
- 9409 Ivy Brook Run Unit 1305
- 9420 Ivy Brook Run Unit 301
- 9440 Ivy Brook Run Unit 503
- 12010 Rock Brook Run Unit 1704
- 9450 Ivy Brook Run Unit 602
- 12021 Rock Brook Run Unit 2105
- 9460 Ivy Brook Run Unit 701
- 9460 Ivy Brook Run Unit 710
- 9460 Ivy Brook Run Unit 705
- 123 Meadow Rd
- 9465 Ivy Brook Run Unit 901
- 117 Meadow Rd
- 551-553 Meadow Rd
- 5321 28th St SW
- 186 Meadow Rd
- 9754 Blue Stone Cir
- 5211 29th St SW
- 12537 Gemstone Ct
- 9409 Ivy Brook Run
- 9409 Ivy Brook Run Unit 1309
- 9409 Ivy Brook Run Unit 1307
- 9409 Ivy Brook Run Unit 1308
- 9409 Ivy Brook Run Unit 1310
- 9409 Ivy Brook Run Unit 1304
- 9409 Ivy Brook Run Unit 1301
- 9409 Ivy Brook Run Unit 1303
- 9409 Ivy Brook Unit 1310
- 9419 Ivy Brook Unit 1205
- 9419 Ivy Brook Run Unit 1201
- 9419 Ivy Brook Run Unit 1210
- 9419 Ivy Brook Run Unit 1208
- 9419 Ivy Brook Run Unit 1207
- 9419 Ivy Brook Run Unit 1209
- 9419 Ivy Brook Run Unit 1204
- 9419 Ivy Brook Run Unit 1203
- 9419 Ivy Brook Run Unit 1205
- 9419 Ivy Brook Run Unit 1202
- 9410 Ivy Brook Run