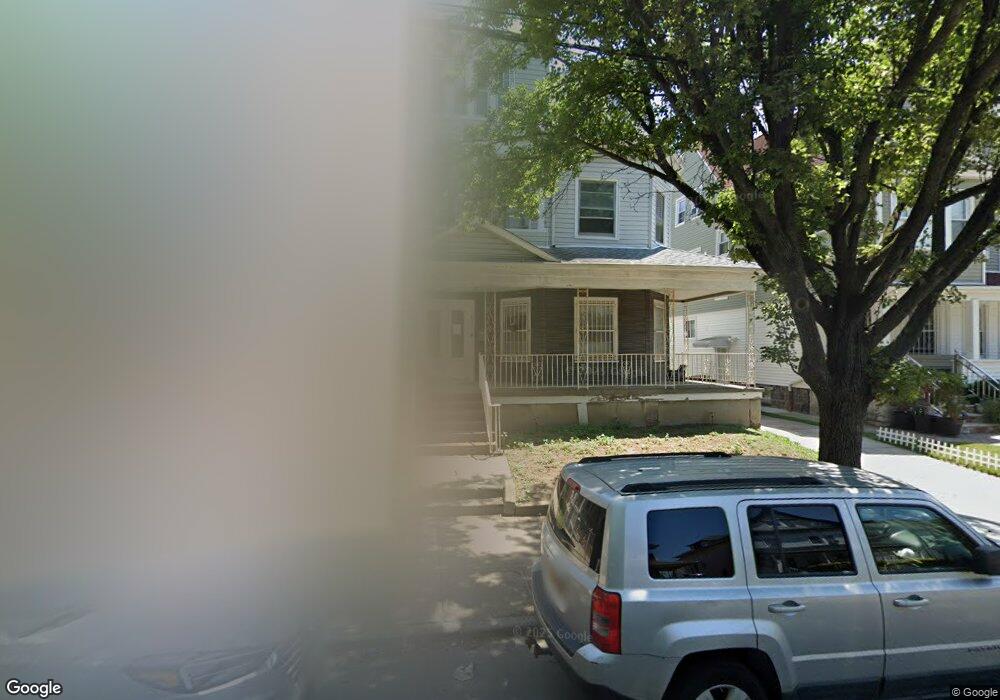
941 E 34th St Brooklyn, NY 11210
East Flatbush NeighborhoodEstimated Value: $1,059,000 - $1,563,075
6
Beds
3
Baths
2,556
Sq Ft
$514/Sq Ft
Est. Value
About This Home
This home is located at 941 E 34th St, Brooklyn, NY 11210 and is currently estimated at $1,313,519, approximately $513 per square foot. 941 E 34th St is a home located in Kings County with nearby schools including P.S. 109, Andries Hudde School, and Midwood Montessori.
Ownership History
Date
Name
Owned For
Owner Type
Purchase Details
Closed on
Jan 31, 2025
Sold by
Blazer Development Llc
Bought by
E34 As Properties Llc
Current Estimated Value
Purchase Details
Closed on
Jul 21, 2021
Sold by
Ramlal Lois and Ramlal Richard
Bought by
Blazer Development Llc
Purchase Details
Closed on
Jun 3, 2010
Sold by
Mcrae Janice and Ramlal Richard
Bought by
Ramlal Lois and Ramlal Richard
Purchase Details
Closed on
Mar 5, 2009
Sold by
Engle Regina
Bought by
Mcrae Janice and Ramlal Richard
Home Financials for this Owner
Home Financials are based on the most recent Mortgage that was taken out on this home.
Original Mortgage
$461,080
Interest Rate
5.25%
Mortgage Type
Purchase Money Mortgage
Purchase Details
Closed on
Oct 31, 1996
Sold by
Engle Regina
Bought by
Engle Regina
Create a Home Valuation Report for This Property
The Home Valuation Report is an in-depth analysis detailing your home's value as well as a comparison with similar homes in the area
Home Values in the Area
Average Home Value in this Area
Purchase History
| Date | Buyer | Sale Price | Title Company |
|---|---|---|---|
| E34 As Properties Llc | -- | -- | |
| E34 As Properties Llc | -- | -- | |
| Blazer Development Llc | $515,090 | -- | |
| Blazer Development Llc | $515,090 | -- | |
| Blazer Development Llc | $515,090 | -- | |
| Ramlal Lois | -- | -- | |
| Ramlal Lois | -- | -- | |
| Mcrae Janice | $477,000 | -- | |
| Mcrae Janice | $477,000 | -- | |
| Engle Regina | -- | First American Title Ins Co | |
| Engle Regina | -- | First American Title Ins Co |
Source: Public Records
Mortgage History
| Date | Status | Borrower | Loan Amount |
|---|---|---|---|
| Previous Owner | Mcrae Janice | $461,080 |
Source: Public Records
Tax History
| Year | Tax Paid | Tax Assessment Tax Assessment Total Assessment is a certain percentage of the fair market value that is determined by local assessors to be the total taxable value of land and additions on the property. | Land | Improvement |
|---|---|---|---|---|
| 2025 | $8,850 | $93,480 | $26,220 | $67,260 |
| 2024 | $8,850 | $78,180 | $26,220 | $51,960 |
| 2023 | $8,715 | $69,780 | $26,220 | $43,560 |
| 2022 | $8,082 | $72,660 | $26,220 | $46,440 |
| 2021 | $7,742 | $69,120 | $26,220 | $42,900 |
| 2020 | $5,795 | $74,460 | $26,220 | $48,240 |
| 2019 | $7,389 | $74,460 | $26,220 | $48,240 |
| 2018 | $6,992 | $35,761 | $18,235 | $17,526 |
| 2017 | $6,578 | $33,737 | $21,182 | $12,555 |
| 2016 | $6,053 | $31,828 | $24,022 | $7,806 |
| 2015 | $3,619 | $31,828 | $21,818 | $10,010 |
| 2014 | $3,619 | $30,600 | $21,840 | $8,760 |
Source: Public Records
Map
Nearby Homes
- 3215 Avenue H Unit 7G
- 3215 Avenue H Unit 11M
- 3215 Avenue H Unit 3P
- 3320 Avenue H Unit 6P
- 927 E 35th St
- 3220 Avenue H Unit 4L
- 3220 Avenue H Unit 1J
- 3220 Avenue H Unit 6N
- 3220 Avenue H Unit 4B
- 3220 Avenue H Unit 4-H
- 3220 Avenue H Unit 3
- 3220 Avenue H Unit 1E
- 3510 Avenue H Unit 3 H
- 720 E 32nd St Unit 5G
- 745 E 31st St Unit 2M
- 745 E 31st St Unit 2L
- 745 E 31st St Unit 5K
- 745 E 31st St Unit 4C
- 745 E 31st St Unit 4B
- 745 E 31st St Unit 6J
- 935 E 34th St
- 947 E 34th St
- 929 E 34th St
- 949 E 34th St
- 876 E 35th St
- 872 E 35th St
- 880 E 35th St
- 880 E 35th St Unit 1
- 880 E 35th St Unit 2
- 880 E 35th St Unit 3
- 925 E 34th St
- 955 E 34th St
- 868 E 35th St
- 890 E 35th St
- 864 E 35th St
- 940 E 34th St
- 894 E 35th St
- 921 E 34th St
- 959 E 34th St
- 936 E 34th St
Your Personal Tour Guide
Ask me questions while you tour the home.