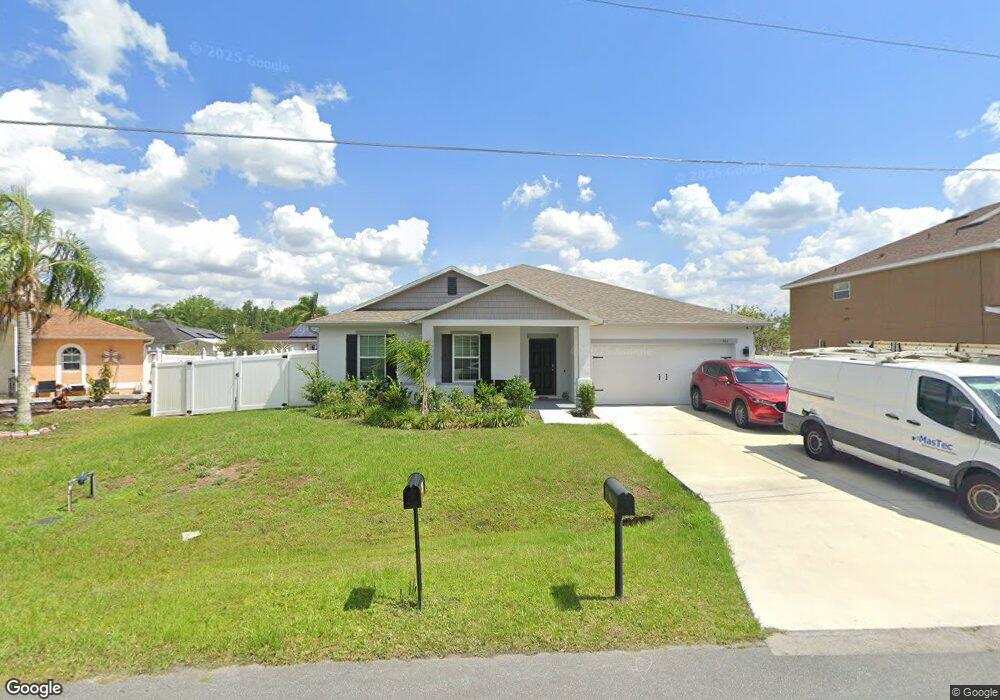
941 Nancy Ct Kissimmee, FL 34759
Estimated Value: $282,000 - $295,662
4
Beds
2
Baths
1,865
Sq Ft
$154/Sq Ft
Est. Value
About This Home
This home is located at 941 Nancy Ct, Kissimmee, FL 34759 and is currently estimated at $286,916, approximately $153 per square foot. 941 Nancy Ct is a home with nearby schools including Chestnut Elementary School For Science And Engineering, Discovery Intermediate School, and Liberty High School.
Ownership History
Date
Name
Owned For
Owner Type
Purchase Details
Closed on
Nov 4, 2022
Sold by
Maronda Homes Llc
Bought by
Torres Luis Angel and Torres Sharon Milagros
Current Estimated Value
Home Financials for this Owner
Home Financials are based on the most recent Mortgage that was taken out on this home.
Original Mortgage
$282,726
Outstanding Balance
$273,959
Interest Rate
6.95%
Mortgage Type
VA
Estimated Equity
$12,957
Purchase Details
Closed on
May 19, 2021
Sold by
Perez Maria S
Bought by
Maronda Homes Llc
Create a Home Valuation Report for This Property
The Home Valuation Report is an in-depth analysis detailing your home's value as well as a comparison with similar homes in the area
Home Values in the Area
Average Home Value in this Area
Purchase History
| Date | Buyer | Sale Price | Title Company |
|---|---|---|---|
| Torres Luis Angel | $276,400 | Steel City Title | |
| Maronda Homes Llc | $105,000 | Steel City Title |
Source: Public Records
Mortgage History
| Date | Status | Borrower | Loan Amount |
|---|---|---|---|
| Open | Torres Luis Angel | $282,726 |
Source: Public Records
Tax History Compared to Growth
Tax History
| Year | Tax Paid | Tax Assessment Tax Assessment Total Assessment is a certain percentage of the fair market value that is determined by local assessors to be the total taxable value of land and additions on the property. | Land | Improvement |
|---|---|---|---|---|
| 2024 | $3,540 | $255,700 | $53,000 | $202,700 |
| 2023 | $3,540 | $254,100 | $48,000 | $206,100 |
| 2022 | $517 | $37,000 | $37,000 | $0 |
| 2021 | $270 | $21,800 | $21,800 | $0 |
| 2020 | $260 | $21,800 | $21,800 | $0 |
| 2019 | $236 | $19,000 | $19,000 | $0 |
| 2018 | $198 | $14,200 | $14,200 | $0 |
| 2017 | $175 | $11,400 | $11,400 | $0 |
| 2016 | $200 | $13,300 | $13,300 | $0 |
| 2015 | $196 | $13,300 | $13,300 | $0 |
| 2014 | $208 | $16,000 | $16,000 | $0 |
Source: Public Records
Map
Nearby Homes