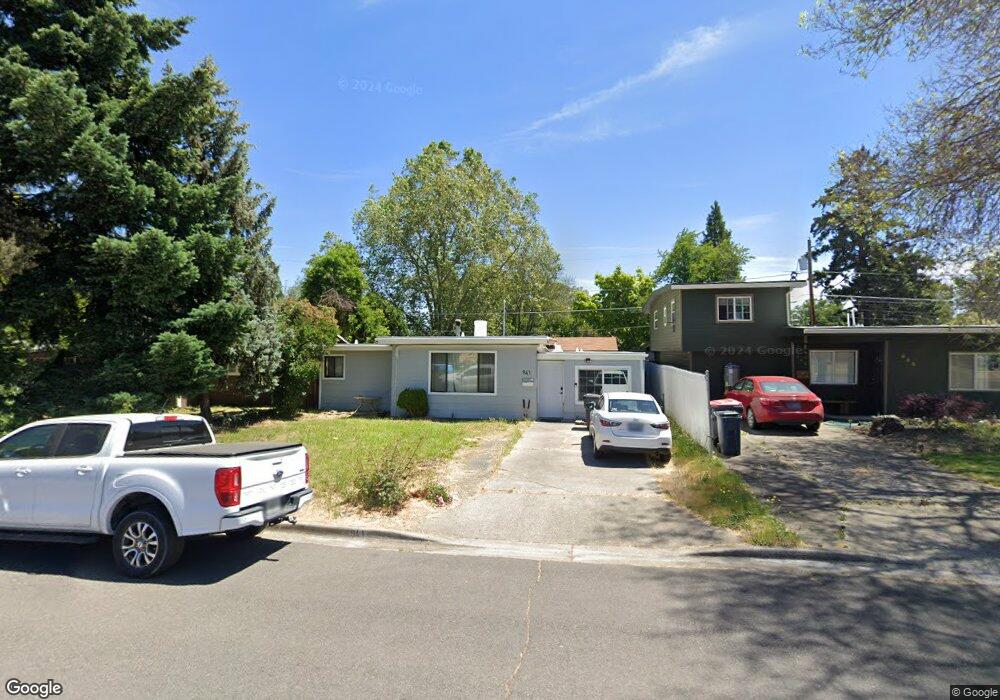
941 S Ivy St Medford, OR 97501
Estimated Value: $268,156 - $296,000
3
Beds
2
Baths
1,008
Sq Ft
$280/Sq Ft
Est. Value
About This Home
This home is located at 941 S Ivy St, Medford, OR 97501 and is currently estimated at $282,052, approximately $279 per square foot. 941 S Ivy St is a home located in Jackson County with nearby schools including Jefferson Elementary School, McLoughlin Middle School, and South Medford High School.
Ownership History
Date
Name
Owned For
Owner Type
Purchase Details
Closed on
Jun 27, 2025
Sold by
Russell Eli J
Bought by
Russell Sara
Current Estimated Value
Purchase Details
Closed on
Jan 9, 2003
Sold by
Torrey James O
Bought by
Russell Eli J and Russell Sara
Home Financials for this Owner
Home Financials are based on the most recent Mortgage that was taken out on this home.
Original Mortgage
$100,503
Interest Rate
6.06%
Mortgage Type
FHA
Purchase Details
Closed on
May 17, 2000
Sold by
Edwards Cris Todd
Bought by
Torrey James O
Home Financials for this Owner
Home Financials are based on the most recent Mortgage that was taken out on this home.
Original Mortgage
$70,200
Interest Rate
8.22%
Create a Home Valuation Report for This Property
The Home Valuation Report is an in-depth analysis detailing your home's value as well as a comparison with similar homes in the area
Home Values in the Area
Average Home Value in this Area
Purchase History
| Date | Buyer | Sale Price | Title Company |
|---|---|---|---|
| Russell Sara | -- | None Listed On Document | |
| Russell Eli J | -- | Amerititle | |
| Torrey James O | $78,000 | Amerititle |
Source: Public Records
Mortgage History
| Date | Status | Borrower | Loan Amount |
|---|---|---|---|
| Previous Owner | Russell Eli J | $100,503 | |
| Previous Owner | Torrey James O | $70,200 |
Source: Public Records
Tax History Compared to Growth
Tax History
| Year | Tax Paid | Tax Assessment Tax Assessment Total Assessment is a certain percentage of the fair market value that is determined by local assessors to be the total taxable value of land and additions on the property. | Land | Improvement |
|---|---|---|---|---|
| 2025 | $1,459 | $100,580 | $39,470 | $61,110 |
| 2024 | $1,459 | $97,660 | $38,330 | $59,330 |
| 2023 | $1,414 | $94,820 | $37,220 | $57,600 |
| 2022 | $1,380 | $94,820 | $37,220 | $57,600 |
| 2021 | $1,344 | $92,060 | $36,140 | $55,920 |
| 2020 | $1,316 | $89,380 | $35,090 | $54,290 |
| 2019 | $1,285 | $84,260 | $33,090 | $51,170 |
| 2018 | $1,252 | $81,810 | $32,130 | $49,680 |
| 2017 | $1,229 | $81,810 | $32,130 | $49,680 |
| 2016 | $1,237 | $77,120 | $30,290 | $46,830 |
| 2015 | $1,189 | $77,120 | $30,290 | $46,830 |
| 2014 | $1,168 | $72,700 | $28,550 | $44,150 |
Source: Public Records
Map
Nearby Homes