Estimated Value: $1,062,000 - $1,152,000
5
Beds
5
Baths
3,353
Sq Ft
$335/Sq Ft
Est. Value
About This Home
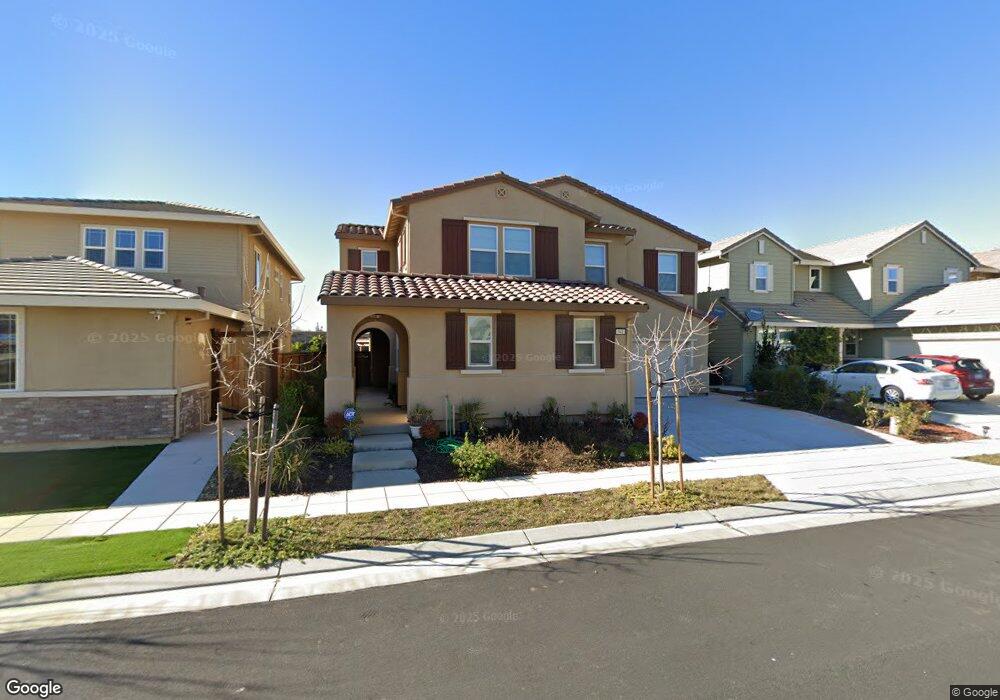
This home is located at 941 S Sara Lyda Ct, Tracy, CA 95391 and is currently estimated at $1,122,202, approximately $334 per square foot. 941 S Sara Lyda Ct is a home with nearby schools including Wicklund Elementary School, Altamont Elementary School, and Mountain House High School.
Ownership History
Date
Name
Owned For
Owner Type
Purchase Details
Closed on
May 20, 2020
Sold by
Randhawa Harman S and Randhawa Baldev Singh
Bought by
Randhawa Harman S
Current Estimated Value
Home Financials for this Owner
Home Financials are based on the most recent Mortgage that was taken out on this home.
Original Mortgage
$312,000
Outstanding Balance
$217,734
Interest Rate
3.2%
Mortgage Type
New Conventional
Estimated Equity
$904,468
Purchase Details
Closed on
Jul 24, 2017
Sold by
Randhawa Bhupinder
Bought by
Randhawa Baldev Singh
Home Financials for this Owner
Home Financials are based on the most recent Mortgage that was taken out on this home.
Original Mortgage
$398,229
Interest Rate
3.91%
Mortgage Type
New Conventional
Purchase Details
Closed on
Jul 12, 2017
Sold by
Richmond American Homes Of Maryland Inc
Bought by
Randhawa Harman S and Randhawa Baldev Singh
Home Financials for this Owner
Home Financials are based on the most recent Mortgage that was taken out on this home.
Original Mortgage
$398,229
Interest Rate
3.91%
Mortgage Type
New Conventional
Create a Home Valuation Report for This Property
The Home Valuation Report is an in-depth analysis detailing your home's value as well as a comparison with similar homes in the area
Purchase History
We collect this data history from publicly available records. To have your information removed, we recommend requesting removal directly through your county’s website.
| Date | Buyer | Sale Price | Title Company |
|---|---|---|---|
| Randhawa Harman S | -- | Orange Coast Title | |
| Randhawa Baldev Singh | -- | First American Title Company | |
| Randhawa Harman S | $664,000 | First American Title Company |
Source: Public Records
Mortgage History
We collect this data history from publicly available records. To have your information removed, we recommend requesting removal directly through your county’s website.
| Date | Status | Borrower | Loan Amount |
|---|---|---|---|
| Open | Randhawa Harman S | $312,000 | |
| Closed | Randhawa Harman S | $398,229 |
Source: Public Records
Tax History
| Year | Tax Paid | Tax Assessment Tax Assessment Total Assessment is a certain percentage of the fair market value that is determined by local assessors to be the total taxable value of land and additions on the property. | Land | Improvement |
|---|---|---|---|---|
| 2025 | $12,500 | $755,194 | $264,545 | $490,649 |
| 2024 | $12,172 | $740,380 | $259,356 | $481,024 |
| 2023 | $11,959 | $725,864 | $254,271 | $471,593 |
| 2022 | $11,705 | $711,633 | $249,286 | $462,347 |
| 2021 | $11,573 | $697,681 | $244,399 | $453,282 |
| 2020 | $11,436 | $690,528 | $241,893 | $448,635 |
| 2019 | $11,294 | $676,989 | $237,150 | $439,839 |
| 2018 | $12,379 | $663,715 | $232,500 | $431,215 |
| 2017 | $5,841 | $184,328 | $184,328 | $0 |
| 2016 | $1,877 | $180,715 | $180,715 | $0 |
| 2015 | $1,460 | $140,000 | $140,000 | $0 |
Source: Public Records
Map
Nearby Homes
- 1070 S Atwood Ct
- 833 S Amor St
- 277 W Camarada Ave
- 726 S Escuela Dr
- 311 W Fauna Ave
- 202 W Fauna Ave
- 1005 S Fowler Ln
- 828 W Simplicidad St
- 698 W Rico Way
- 228 W Heritage Dr
- 1120 S Shields Ave
- 763 Adam St
- 34 Felicia Ave
- 140 W Brilloso Ln
- 1339 N Galvani Ct
- 464 E Yarrow Place
- 43 W Casita Ln
- 116 W Limerick Ave
- 151 S Vista Hermosa St
- 80 E Cortona Ct
- 949 S Sara Lyda Ct
- 933 S Sara Lyda Ct
- 957 S Atwood Ln
- 925 S Sara Lyda Ct
- 671 W Royce Dr
- 917 S Sara Lyda Ct
- 965 S Atwood Ln
- 936 S Sara Lyda Ct
- 973 S Atwood Ln
- 667 W Royce Dr
- 928 S Sara Lyda Ct
- 909 S Sara Lyda Ct
- 676 W Royce Dr
- 920 S Sara Lyda Ct
- 981 S Atwood Ln
- 633 W Royce Dr
- 22 E Hammet Place
- 658 W Royce Dr
- 935 S Tupper Ct
- 912 S Sara Lyda Ct
Your Personal Tour Guide
Ask me questions while you tour the home.