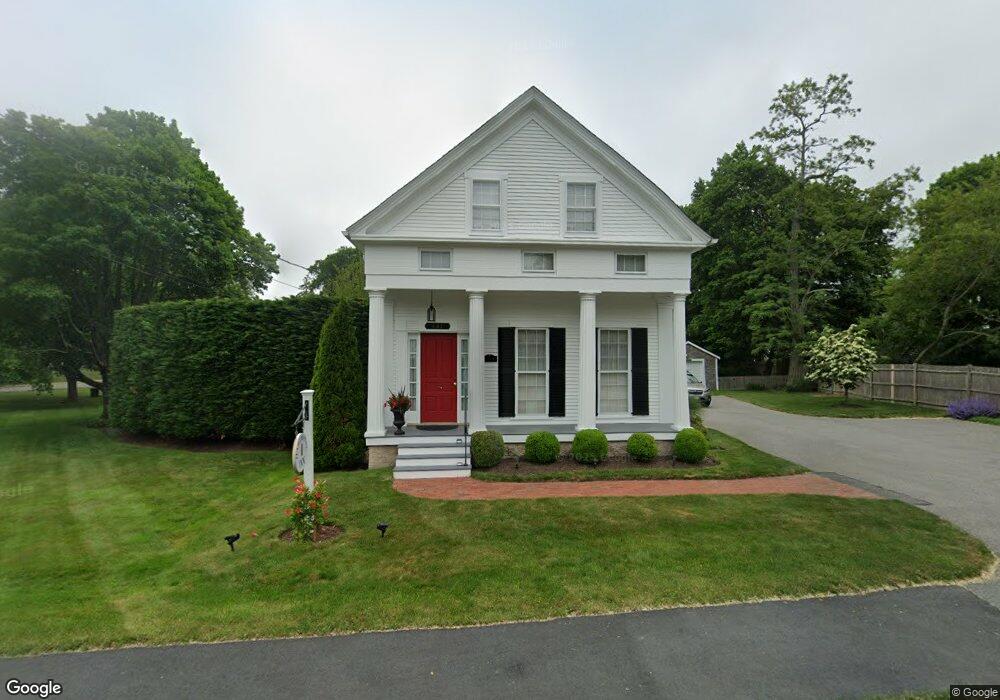
941 Sandwich Rd Sagamore, MA 2561
Estimated Value: $692,363
4
Beds
2
Baths
2,023
Sq Ft
$342/Sq Ft
Est. Value
About This Home
This home is located at 941 Sandwich Rd, Sagamore, MA 2561 and is currently estimated at $692,363, approximately $342 per square foot. 941 Sandwich Rd is a home located in Barnstable County with nearby schools including Bourne High School, Bridgeview Montessori School, and Waldorf School of Cape Cod.
Ownership History
Date
Name
Owned For
Owner Type
Purchase Details
Closed on
Aug 27, 2004
Sold by
Mitchke Michael J and Mitchke Rosa L
Bought by
Sullivan Kathleen M
Current Estimated Value
Purchase Details
Closed on
Aug 13, 1999
Sold by
Rigazio Paula F and Hockenberry Diane
Bought by
Mitchke Michael J and Mitchke Rosa L
Create a Home Valuation Report for This Property
The Home Valuation Report is an in-depth analysis detailing your home's value as well as a comparison with similar homes in the area
Home Values in the Area
Average Home Value in this Area
Purchase History
| Date | Buyer | Sale Price | Title Company |
|---|---|---|---|
| Sullivan Kathleen M | $340,000 | -- | |
| Sullivan Kathleen M | $340,000 | -- | |
| Mitchke Michael J | $100,000 | -- | |
| Mitchke Michael J | $100,000 | -- |
Source: Public Records
Mortgage History
| Date | Status | Borrower | Loan Amount |
|---|---|---|---|
| Open | Mitchke Michael J | $228,000 | |
| Previous Owner | Mitchke Michael J | $140,000 | |
| Previous Owner | Mitchke Michael J | $29,000 |
Source: Public Records
Tax History Compared to Growth
Tax History
| Year | Tax Paid | Tax Assessment Tax Assessment Total Assessment is a certain percentage of the fair market value that is determined by local assessors to be the total taxable value of land and additions on the property. | Land | Improvement |
|---|---|---|---|---|
| 2025 | $3,785 | $484,600 | $165,300 | $319,300 |
| 2024 | $4,123 | $514,100 | $177,100 | $337,000 |
| 2023 | $4,143 | $470,300 | $156,800 | $313,500 |
| 2022 | $4,505 | $446,500 | $138,700 | $307,800 |
| 2021 | $4,054 | $376,400 | $126,300 | $250,100 |
| 2020 | $4,012 | $373,600 | $125,100 | $248,500 |
| 2019 | $3,785 | $360,100 | $125,100 | $235,000 |
| 2018 | $3,618 | $343,300 | $119,100 | $224,200 |
| 2017 | $3,603 | $349,800 | $144,200 | $205,600 |
| 2016 | $3,407 | $335,300 | $144,200 | $191,100 |
| 2015 | $2,981 | $296,000 | $104,900 | $191,100 |
Source: Public Records
Map
Nearby Homes
- 51 Commonwealth Ave
- 51 Commonwealth Ave
- 33 Buzzards Bay Ave
- 6 Louis Ave
- 15 Route 6a
- 4 Fieldwood Dr
- 38 Siasconset Dr
- 42 Siasconset Dr
- 4 Fieldwood Dr
- 5 Candlewood Dr
- 18 Ocean Pines Dr Unit A
- 4 Bittersweet Ln Unit 4
- 2 Dogwood Rd Unit 2
- 2 Dogwood Rd
- 150 Herring Pond Rd
- 71 Tupper Rd
- 0 State Rd
- 311 Phillips Rd
- 133 Phillips Rd
- 5 Oakwood Dr
- 10 Pleasant St
- 947 Sandwich Rd
- 947 Sandwich Rd Unit 947
- 947 Sandwich Rd
- 947 Sandwich Rd
- 16 Pleasant St
- 940 Sandwich Rd
- 16 Pleasant St
- 11 Briggs Ave
- 11 Briggs Ave
- 11 Briggs Ave
- 5 Briggs Ave
- 5 Briggs Ave
- 940 Sandwich Rd
- 940 Sandwich Rd Unit 1
- 15 Bridge St
- 5 Pleasant St
- 18 Pleasant St
- 10 Briggs Ave
- 10 Bridge St