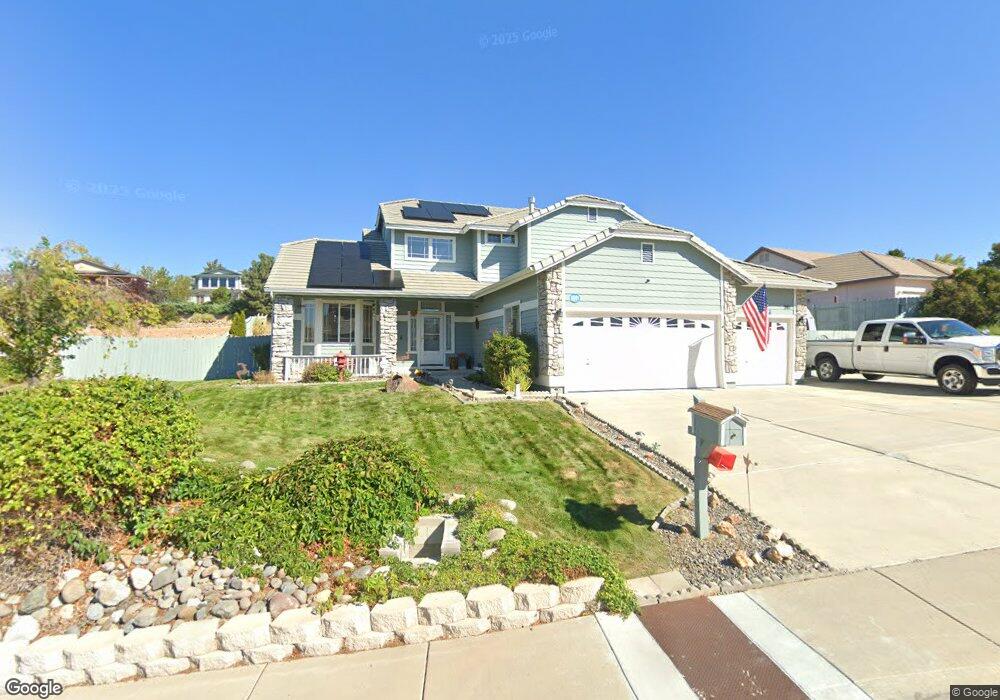
941 University Place Unit 4 Reno, NV 89512
West University NeighborhoodEstimated Value: $687,567 - $837,000
4
Beds
3
Baths
2,333
Sq Ft
$329/Sq Ft
Est. Value
About This Home
This home is located at 941 University Place Unit 4, Reno, NV 89512 and is currently estimated at $766,392, approximately $328 per square foot. 941 University Place Unit 4 is a home located in Washoe County with nearby schools including Peavine Elementary School, Archie Clayton Pre-AP Academy, and Coral Academy Charter School Elementary.
Ownership History
Date
Name
Owned For
Owner Type
Purchase Details
Closed on
Jun 12, 2002
Sold by
Theadore Orra M
Bought by
Duncan James V and Duncan Joyce M
Current Estimated Value
Home Financials for this Owner
Home Financials are based on the most recent Mortgage that was taken out on this home.
Original Mortgage
$260,000
Interest Rate
6.74%
Purchase Details
Closed on
Dec 1, 1999
Sold by
Tesseo Jon and Tesseo Lalitny
Bought by
Theadore Orra M
Purchase Details
Closed on
Oct 15, 1996
Sold by
Highlands Communities Llc
Bought by
Tesseo Jon and Tesseo Lalitny
Home Financials for this Owner
Home Financials are based on the most recent Mortgage that was taken out on this home.
Original Mortgage
$219,438
Interest Rate
8.37%
Create a Home Valuation Report for This Property
The Home Valuation Report is an in-depth analysis detailing your home's value as well as a comparison with similar homes in the area
Home Values in the Area
Average Home Value in this Area
Purchase History
| Date | Buyer | Sale Price | Title Company |
|---|---|---|---|
| Duncan James V | $289,000 | First Centennial Title Co | |
| Theadore Orra M | $260,000 | Stewart Title Company | |
| Tesseo Jon | $227,000 | Western Title Company Inc |
Source: Public Records
Mortgage History
| Date | Status | Borrower | Loan Amount |
|---|---|---|---|
| Closed | Duncan James V | $260,000 | |
| Previous Owner | Tesseo Jon | $219,438 |
Source: Public Records
Tax History Compared to Growth
Tax History
| Year | Tax Paid | Tax Assessment Tax Assessment Total Assessment is a certain percentage of the fair market value that is determined by local assessors to be the total taxable value of land and additions on the property. | Land | Improvement |
|---|---|---|---|---|
| 2025 | $3,148 | $134,403 | $46,783 | $87,620 |
| 2024 | $3,148 | $131,015 | $42,000 | $89,015 |
| 2023 | $3,058 | $125,817 | $41,545 | $84,272 |
| 2022 | $2,978 | $112,364 | $42,035 | $70,329 |
| 2021 | $3,001 | $96,562 | $26,460 | $70,102 |
| 2020 | $2,911 | $99,140 | $28,665 | $70,475 |
| 2019 | $2,827 | $96,225 | $27,563 | $68,662 |
| 2018 | $2,638 | $89,560 | $23,888 | $65,672 |
| 2017 | $2,561 | $85,231 | $19,294 | $65,937 |
| 2016 | $2,496 | $85,107 | $18,008 | $67,099 |
| 2015 | $2,494 | $83,970 | $16,538 | $67,432 |
| 2014 | $2,422 | $77,805 | $12,826 | $64,979 |
| 2013 | -- | $63,903 | $9,482 | $54,421 |
Source: Public Records
Map
Nearby Homes
- 865 N University Park Loop
- 1080 S University Park Loop
- 730 Icarus Ct
- 1120 University Park Ct
- 3495 Comstock Dr
- 3648 Hollywood Park Dr
- 970 Demos Ct
- 3621 Pimlico St
- 3566 Penn National Dr
- 1175 Arrastra Rd Unit Lot 13
- 34 Cabernet Pkwy
- 3571 Penn National Dr
- 1176 Arrastra Rd Unit Lot 16
- 1172 Arrastra Rd
- 15 Chianti Way
- 3421 Colonial Downs Dr
- 2135 Barberry Way
- 3745 Thistledown Ct
- 27 Chianti Way
- 20 Semillon Ct
- 951 University Place
- 931 University Place Unit 1
- 910 S University Park Loop
- 961 University Place
- 900 S University Park Loop
- 920 S University Park Loop
- 921 University Place
- 926 University Place
- 936 University Place
- 890 S University Park Loop Unit 3
- 946 University Place
- 971 University Place
- 956 University Place
- 880 S University Park Loop
- 966 University Place
- 930 S University Park Loop
- 911 University Place
- 901 S University Park Loop
- 870 S University Park Loop
- 905 University Place