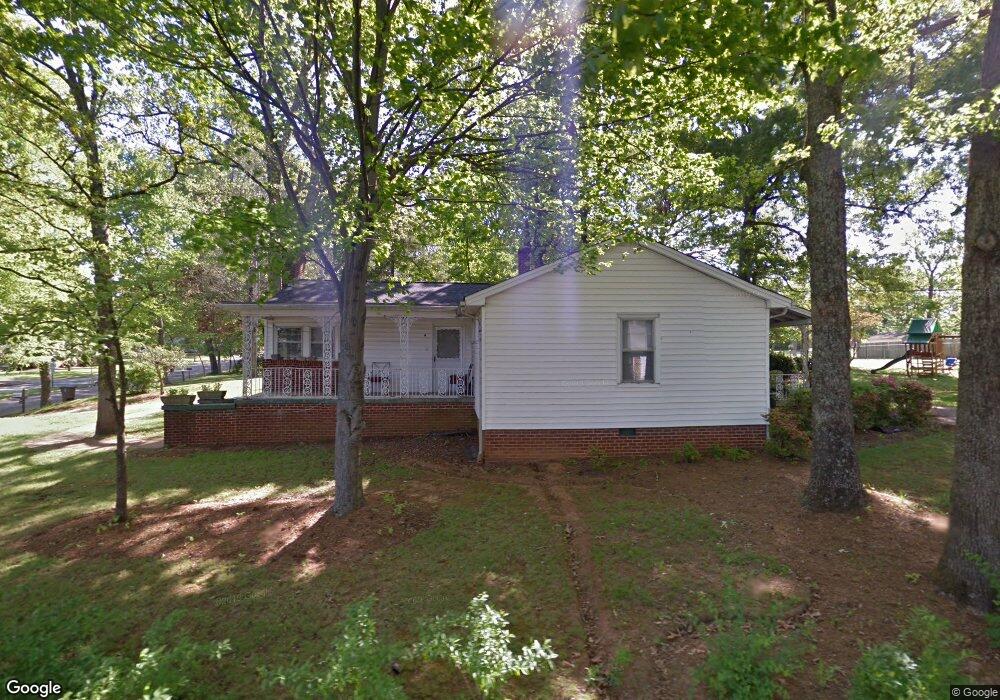
941 W Warren St Shelby, NC 28150
Estimated Value: $142,000 - $213,000
--
Bed
--
Bath
1,480
Sq Ft
$117/Sq Ft
Est. Value
About This Home
This home is located at 941 W Warren St, Shelby, NC 28150 and is currently estimated at $173,593, approximately $117 per square foot. 941 W Warren St is a home located in Cleveland County with nearby schools including Graham Elementary School, Shelby Middle School, and Shelby High School.
Ownership History
Date
Name
Owned For
Owner Type
Purchase Details
Closed on
Oct 12, 2017
Sold by
Vfs Lending Services Llc
Bought by
Huss Brothers Investments Llc
Current Estimated Value
Purchase Details
Closed on
Nov 10, 2014
Sold by
Eh Pooled 114 Lp
Bought by
Curry Darian Lavon
Purchase Details
Closed on
May 9, 2014
Sold by
Deutsche Bank National Trust Company
Bought by
Eh Pooled 114 Limited Partnership
Purchase Details
Closed on
Jan 14, 2014
Sold by
Cline Marshall
Bought by
Deutsche Bank National Trust Co
Purchase Details
Closed on
Nov 27, 2006
Sold by
Bridge Gladys and Ramsey Ouida Joy Champion
Bought by
Cline Marshall
Home Financials for this Owner
Home Financials are based on the most recent Mortgage that was taken out on this home.
Original Mortgage
$63,600
Interest Rate
7.64%
Mortgage Type
Assumption
Create a Home Valuation Report for This Property
The Home Valuation Report is an in-depth analysis detailing your home's value as well as a comparison with similar homes in the area
Home Values in the Area
Average Home Value in this Area
Purchase History
| Date | Buyer | Sale Price | Title Company |
|---|---|---|---|
| Huss Brothers Investments Llc | $33,500 | None Available | |
| Curry Darian Lavon | $25,000 | Attorney | |
| Eh Pooled 114 Limited Partnership | $18,000 | None Available | |
| Deutsche Bank National Trust Co | $46,000 | None Available | |
| Cline Marshall | $79,500 | None Available |
Source: Public Records
Mortgage History
| Date | Status | Borrower | Loan Amount |
|---|---|---|---|
| Previous Owner | Cline Marshall | $63,600 |
Source: Public Records
Tax History Compared to Growth
Tax History
| Year | Tax Paid | Tax Assessment Tax Assessment Total Assessment is a certain percentage of the fair market value that is determined by local assessors to be the total taxable value of land and additions on the property. | Land | Improvement |
|---|---|---|---|---|
| 2025 | $1,244 | $125,006 | $19,040 | $105,966 |
| 2024 | $1,115 | $90,476 | $16,576 | $73,900 |
| 2023 | $1,110 | $90,476 | $16,576 | $73,900 |
| 2022 | $1,110 | $90,476 | $16,576 | $73,900 |
| 2021 | $1,115 | $90,476 | $16,576 | $73,900 |
| 2020 | $994 | $78,191 | $16,576 | $61,615 |
| 2019 | $994 | $78,191 | $16,576 | $61,615 |
| 2018 | $992 | $78,191 | $16,576 | $61,615 |
| 2017 | $968 | $78,191 | $16,576 | $61,615 |
| 2016 | $970 | $78,191 | $16,576 | $61,615 |
| 2015 | $1,054 | $89,669 | $16,576 | $73,093 |
| 2014 | $1,054 | $89,669 | $16,576 | $73,093 |
Source: Public Records
Map
Nearby Homes
- 937 W Warren St
- 204 Charles Rd
- 206 Charles Rd
- 207 Charles Rd
- 1003 W Warren St
- 935 W Warren St
- 209 Charles Rd
- 208 Charles Rd
- 1005 W Warren St
- 210 Charles Rd
- 933 W Warren St
- 940 W Warren St
- 300 Charles Rd
- 938 W Warren St
- 1009 W Warren St
- 931 W Warren St
- 1206 W Dixon Blvd
- 1502 W Warren St
- 121 Lattimore St
- 121 Carl Ln